PicoScope 7 Software
Available on Windows, Mac and Linux
A to Z of PC oscilloscopes
Everything you need to know about PC oscilloscopes from Advanced Triggers to Zooming.

A to Z of Data Loggers
Everything you need to know about PC-based data loggers from Alarms to Zooming.
Application Notes
Details of some of the many applications for Pico data logger and oscilloscope products.

How do I measure...?
Find out how you can measure using Pico products

Videos
Showing you how to get the most out of PicoScope oscilloscope software.

Documentation
Up-to-date versions of the documentation supplied with your products in PDF format.

Educational Experiments
Our library of science experiments suitable for use with oscilloscope and data logging products.

PicoApps
Want to share hints, tips and code with other developers? Show your Pico-based products to the world.

Newsletter
Archive of our monthly Test and Measurement Newsletters.


AC Coupling uses filtering to remove the DC component of a signal, displaying just the AC component of the signal alternating around 0 VDC (Ground).
This coupling mode allows measurement of AC signals such as: ripple along a DC power supply, or measuring a biased signal through a transistor amplifier. AC Coupling will remove the DC component, revealing just the AC signal.

Actions can be programmed in PicoScope 7 and will execute when certain events occur. The events that can trigger an action are:
The actions that PicoScope can execute are:
Actions, coupled with mask limit testing, help to quickly validate signal quality in electronic system designs. Testing can be done over extended periods of time and while parameters such as supply voltage or temperature are changed to validate that the design operates reliably over the full range of specified operating conditions.

PicoScope software dedicates almost all of the display area to the waveform. This ensures that the maximum amount of data is seen at once. The viewing area is much bigger and of a higher resolution than with a traditional benchtop scope.
With a large display area available, you can also create a customizable split-screen display, and view multiple channels or different views of the same signal at the same time. As the example shows, the software can even show multiple oscilloscope and spectrum analyzer traces at once. Additionally, each waveform shown works with individual zoom, pan, and filter settings for ultimate flexibility.
The PicoScope software can be controlled by mouse, touchscreen or keyboard shortcuts.

Figure1: Out–of–range signal
Also called DC offset, this is a valuable feature available on many PicoScope oscilloscopes. When used correctly, it can give you back the vertical resolution that would otherwise be lost when measuring small signals.
Analog offset adds a DC voltage to the input signal. If the signal is out of range of the scope’s analog-to-digital converter (ADC), the offset can be used to bring the signal back in range allowing a more sensitive range to be used.

Apparent power is the total electrical power present in an AC circuit or system. This figure is important as it determines the sizing of electrical infrastructure required to power the load. The apparent power of the system is made up of both active/true power and reactive power components.
More information on Apparent power measurement and math channel >>

An arbitrary waveform generator (AWG) is used to generate electrical waveforms. The waveforms can be either repetitive or single-shot. An AWG can generate any arbitrarily defined waveshape as its output. The waveforms can be injected into a device under test and analyzed by the PicoScope as they progress through it, confirming proper operation of the device or pinpointing a fault in it.

ARINC 429, also known as the Mark 33 DITS specification, was developed to provide interchangeability and interoperability of line replaceable units (LRUs) in commercial aircraft. ARINC 429 defines the physical and electrical interfaces of a two-wire data bus and the data protocol to support an aircraft's avionics local area network.
The physical connection wires are twisted pairs carrying balanced differential signaling. Data words are 32 bits in length and most messages consist of a single data word. Messages are transmitted at either 12.5 or 100 kbit/s. The transmitter constantly transmits either 32-bit data words or the NULL state. Most ARINC messages contain only one data word consisting of either binary (BNR), or binary coded decimal (BCD).
In addition to twisted-pair cabling, ARINC signaling defines a 10 V peak differential signal, with acceptable voltage rise and fall times for the Data A and Data B levels, and complementary differential bipolar return-to-zero (BPRZ) data encoding to minimize EMI emissions from the cable itself.

If you have lots of input channels, reference channels, and math channels enabled, it can take time to move them around and scale them so that they are all clearly visible. By right-clicking on a view and selecting Auto-Arrange Axes, all the traces are automatically shifted and scaled so that none of them overlap.

Oscilloscope bandwidth is defined as the frequency at which a sine wave input signal is attenuated to 70.7% of the signal’s true amplitude, known as the –3 dB point, a term based on a logarithmic scale.
Bandwidth determines an oscilloscope’s fundamental ability to measure a signal. As signal frequency increases, the capability of the oscilloscope to accurately display the signal decreases.
Without adequate bandwidth, high-frequency signals will be displayed with lower amplitude than the true signal. Rise and fall times will appear slower than the true signal. A common rule of thumb, to achieve better than 3% measurement accuracy, is to use an oscilloscope with five times more bandwidth than the fastest signal component you need to measure.

This is the default mode used by PicoScope software. The scope stores data in internal buffer memory, then processes it and transfers it to the PC before starting the next block.
In the illustration shown, the buffer memory is shared between the two channels on the oscilloscope, allowing two waveforms to be captured in a single run.
Block capture mode gives access to the scope’s fastest real-time sampling rates.
The internal buffer memory can be segmented to allow many waveforms to be collected. Acquisitions continue on a first-in-first-out basis until stopped by the user, or unless the scope is set to "Single" trigger.


BroadR-Reach (IEEE 802.3 100BASE-T1) is an Ethernet physical layer standard designed for use in automotive networking applications. BroadR-Reach technology allows multiple in-vehicle systems to simultaneously access information over low-cost unshielded single twisted pair cable. BroadR-Reach delivers relatively high speed data, 100 Mbps, with low connectivity costs and cabling weight.
PicoScope* can separate the bidirectional Master-Slave and Slave-Master interfering waveforms with a non-intrusive Software Directional Coupler, and can decode and analyze the resulting waveforms to display packets in both directions.
Video: Automotive Ethernet - Decoding & Analysis with PicoScope
* Directional coupler and decoder are included with PicoScope release 6.14.10 or later.
More information on BroadR-Reach serial protocol decoding >>

PicoScope buffer sizes are specified in kS (kilosamples), MS (megasamples) or GS (gigasamples). The makers of the memory chips that we use in PicoScope oscilloscopes usually state memory sizes as powers of 2, and we follow this convention in our specifications.
Here is what we actually mean by kS, MS and GS:
| Unit | Power of 2 | Decimal equivalent |
|---|---|---|
| kS | 210 | 1 024 samples |
| MS | 220 | 1 048 576 samples |
| GS | 230 | 1 073 741 824 samples |
As you can see, these numbers are close but not equal to one thousand, one million and one billion. So, if you buy an oscilloscope with a 1 MS buffer size, don't be surprised if you see a sample count slightly higher than 1 million in the PicoScope Properties panel.
There are also many cases when the PicoScope 6 software gives you a sample count that is lower than the buffer size of your oscilloscope. This happens when PicoScope is in a repeat triggering mode and needs to use part of the memory for storing the next capture. It also happens when you have divided the memory into segments, and the number of segments that you have requested does not fit exactly into the available memory. To ensure that PicoScope 6 captures the greatest possible number of samples, set the Trigger control to Single and the Number of Samples control to a number greater than the buffer size of the oscilloscope.

All PicoScopes are tested to ensure they meet their specifications. This means that you can be confident that all measurements you make with your Pico product will be within the accuracy that we specify.
If you plan to use your product in an industrial or scientific environment where it is necessary to have documented traceability, or you just want your Pico product to be ‘fine-tuned’ to give the best possible performance, then for most of our products we can provide you with a calibration service referenced to National Standards. This means that you will be given documented proof of the accuracy of your Pico product at the time it is despatched to you. This documented proof is in the form of a calibration certificate that has the errors recorded. For example, the product may have a published accuracy of ±3%, and after calibration the error might be recorded as –1%. You can then allow for this –1% error when taking measurements.
For best accuracy, we suggest that a calibrated product is recalibrated yearly.

CAN bus (Controller Area Network) is a serial data standard originally developed in the 1980s by Robert Bosch GmbH for use in automotive applications. Today it is also widely used in industrial process control and aerospace applications.
It allows microcontrollers and electronic devices to communicate with each other without using a host computer and provides fast and reliable data transfer in electrically noisy environments at low cost and with minimal wiring.
CAN employs differential signaling to provide a high level of immunity to electrical noise.
PicoScope software allows many frames of CAN and CAN FD (Flexible Data-rate) data to be fully decoded both in a table format and in a colour-keyed trace, time aligned with the data signal.
More information on CAN & CAN FD - serial protocol decoding >>
CAN XL is the 3rd generation controller-area network protocol, building on and supporting backward compatibility with classic CAN and CAN FD networks. It is targeted at in-vehicle networks, connecting multiple controllers and sensors using a single differential-mode bus. Due to the high level of robustness and use of the bus topology with minimal need for wiring, the controller-area network protocols are increasingly finding their way into new industrial applications.

PicoScope can be run from the Windows command line, allowing you to execute tasks manually or under the control of a batch file or other program.
To get help using the CLI, type:
picoscope /?

The custom probes feature allows you to correct for gain, attenuation, offsets and nonlinearities in probes, sensors or transducers that you connect to the oscilloscope. This could be used to scale the output of a current probe so that it correctly displays amperes. A more advanced use would be to scale the output of a nonlinear temperature sensor using the table lookup function.
Definitions for standard Pico-supplied oscilloscope probes and current clamps are included. User-created probes may be saved for later use.
More information on Custom probes in PicoScope oscilloscope software >>

DALI development board by Microchip Technology Inc.
Similar to CAN Bus communications between ECMs in automotive applications, DALI provides two-way communications between lighting fixtures (“luminaires”), ballasts and controllers in buildings. It is defined in IEC technical standards IEC 62386 and IEC 60929, which cover LED drivers and electronic ballasts used in AC supplies with voltages up to 1000 V and with operating frequencies of 50 Hz or 60 Hz.
PicoScope can decode DALI waveforms: From the Tools menu select Serial Decoding then Create and select DALI from the list of available protocols.

PicoLog Cloud allows all current Pico data loggers and real-time scopes to capture data directly to our new free Cloud service, and can be shared via a link to any browser on a PC, phone or tablet, anywhere in the world. In addition, an API can be used that allows live capture data to be transferred from the Cloud to a third-party database or program.

A DC accuracy specification is a way of stating the worst-case deviation of a measurement device from an ideal linear response. It includes both offset error (an absolute quantity, typically stated in volts) and gain error (relative to full scale, typically stated as a percentage).

PicoScope deep-memory oscilloscopes have waveform buffer sizes up to 2 gigasamples – many times larger than competing scopes of either PC-based or traditional benchtop design. Most other scopes with large buffers slow down when trying to use a lot of memory, so you have to manually adjust the buffer size to suit each application. You don’t have to worry about this with PicoScope deep-memory scopes as hardware acceleration ensures you can always use deep memory while displaying at full speed.
Deep memory produces several benefits: fast sampling at long timebases, timebase zoom, and memory segmentation to let you capture a sequence of events.

DeepMeasure parameters
One waveform, millions of measurements.
Measurement of waveform pulses and cycles is key to verification of the performance of electrical and electronic devices.
DeepMeasure delivers automatic measurements of important waveform parameters, such as pulse width, rise time and voltage. Up to a million cycles can be displayed with each triggered acquisition. Results can be easily sorted, analyzed and correlated with the waveform display.


Fundamentally, all oscilloscopes measure voltage (in the Y axis) against time (in the X axis) and all voltage measurements are made between two points.
Most oscilloscopes are designed with the expectation that one of these points will be fixed firmly to ground, and so the reference lead of the probe connects electrically to the shell of the BNC input, which connects to the chassis, which is grounded through the mains lead.
This presents a problem that most oscilloscope users encounter regularly: many voltage measurements are not referenced to ground.
In fact differential or floating voltages are everywhere and there are many solutions to the problem, though some are more suitable than others.
More information on Differential and floating voltage measurements >>

Differential Manchester encoding (DME) is a technique similar to Manchester encoding used to convert digital data into a format suitable for transmission over a physical medium like a cable. It's a type of line code that combines data and clock signals into a single, self-synchronising two-level data stream. This means no separate clock signal is needed, as the transitions signal both data and timing information, thus reducing cost.
DME uses the presence or absence of transitions (either in the middle of the bit transition or at the bit boundary depending on the DME variant) to indicate logical values (zero or one). As a result DME eliminates any baseline wandering, and data is immune to noise and polarity inversions due to the use of transitions, not absolute voltage levels.
More information on Differential Manchester Encoding (DME) - serial protocol decoding >>

DCC (Digital Command Control) is a standard defined by the National Model Railroad Association (NMRA) DCC Working Group and is a standard for manufacturers to allow the independent control of multiple locomotives and accessories on a train set.
This approach overcomes the limitation of controlling multiple locomotives on the same track where, traditionally, voltage on track was used to control the speed and direction of a train.
The Digital Command Station sends DCC NMRA signals in a differential digital form, by periodically reversing the 15 V DC power supply to the track.
PicoScope software can decode DCC command information being sent to DCC decoders.
More information on Digital Command Control (DCC) protocol decoding >>
The majority of digital oscilloscopes still use an analog triggering architecture based on comparators. This causes time and amplitude errors that cannot always be calibrated out and often limits the trigger sensitivity at high bandwidths.
In 1991 Pico pioneered the use of fully digital triggering using the actual digitized data. This technique reduces trigger errors and allows our oscilloscopes to trigger on the smallest signals, even at the full bandwidth. Trigger levels and hysteresis can be set with high precision and resolution.
The reduced rearm delay provided by digital triggering, together with segmented memory, allows the capture of events that happen in rapid sequence. On many of our products, rapid triggering can capture a new waveform every microsecond until the buffer is full.

Equivalent time sampling (ETS) is method of increasing the effective sampling rate of the scope.
Equivalent-time sampling builds a picture of a repetitive signal by capturing small parts of the waveform from successive triggered acquisitions. This allows PicoScope to accurately capture signals whose frequency components are much higher than the maximum sampling rate.
For accurate results, the signal must be perfectly repetitive and the trigger must be stable.

PicoScope's math channels can be used to apply a sliding-window filter to your signals. All four basic shapes of filter are available:

Decoded FlexRay signal
FlexRay was developed by a consortium of manufacturers to provide a deterministic, fault-tolerant and high-speed alternative to CAN. Now standardized as ISO 17458, FlexRay supports data rates up to 10 Mbit/s on two independent channels for improved fault-tolerance. FlexRay uses a combination of event triggered and time triggered communication, ensuring that network nodes cannot gain uncontrolled network access to signal events, and instead must access the network using a pre-determined time slot to transmit each message using TDMA in what is known as the Communication Cycle.
PicoScope software allows many cycles of FlexRay data to be fully decoded both in a table format and in a colour-keyed trace, time aligned with the data signal.

Most digital oscilloscopes gain their high sampling rates by interleaving multiple 8-bit ADCs. Despite careful design, the interleaving process introduces errors that always make the dynamic performance worse than the performance of the individual ADC cores.
PicoScope FlexRes scopes have a significantly different hardware architecture in which multiple high-resolution ADCs can be applied to the input channels in different time-interleaved and parallel combinations. Thus you can reconfigure the hardware to optimize either for speed or resolution. For example, the PicoScope 5000 Series can boost either the sampling rate to 1 GS/s at 8 bits or the resolution to 16 bits at 62.5 MS/s. The PicoScope 4444 (12 to 14-bit) and 6824E (8 to 12-bit) oscilloscopes also have FlexRes.

Hardware acceleration ensures fast screen update rates even when collecting 10,000,000 samples per waveform
Some oscilloscopes struggle when you enable deep memory; the screen update rate slows and controls become unresponsive. PicoScope deep memory oscilloscopes avoid this limitation with use of a dedicated hardware acceleration engine. Their massively parallel design effectively creates the waveform image to be displayed on the PC screen inside the oscilloscope and allows the continuous capture and display to the screen of 2.5 billion samples every second. PicoScope oscilloscopes manage deep memory better than competing oscilloscopes, both PC-based and benchtop.
Hardware acceleration speeds up areas of oscilloscope operation such as allowing waveform update rates in excess of 170 000 waveforms per second and the segmented memory/rapid trigger modes. The hardware acceleration engine ensures that any concerns about the USB connection or PC processor performance being a bottleneck are eliminated.

The I2C (Inter-Integrated Circuit) bus is a low-speed serial data protocol commonly used to transfer data between components and modules within a single device.
Developed in the early 1980s by Philips Semiconductors (now NXP), I2C employs 2 signal wires to transfer “packets” of information between one or more “master” devices such as microcontrollers, and multiple “slave” devices such as sensors, memory chips, ADC and DACs.
The PicoScope software enables I2C packets to be fully decoded both in a table format, and in a color-keyed trace time-aligned with the data signal.

The input impedance of a PicoScope is the impedance it presents to the oscilloscope probe, if one is used, or otherwise directly to the device under test. It is typically 1 MΩ in parallel with 10 to 15 pF. Some PicoScopes allow their their inputs to be individually switched to 50 Ω impedance, to allow proper termination of 50 Ω cables and sources.

Jitter is uncertainty in the timing of a signal edge. The signal being measured by the oscilloscope may have jitter of its own, caused by unstable frequency, amplitude or pulse width. This is added to the oscilloscope’s intrinsic jitter caused by imperfections in its triggering and timing circuits. PicoScope 9000 Series scopes can display a histogram of edge timings, allowing accurate measurement of jitter.

Figure 1: The Logic Trigger dialog
The PicoScope oscilloscope software offers a wide range of simple and advanced triggers for detecting and capturing elusive signals. Most of these trigger types are capable of monitoring only one signal at a time. Since many oscilloscopes have more than one input—up to eight channels as well as an EXT or AUX input on some models—PicoScope provides a special ‘Logic’ trigger type that can watch for combinations of up to four inputs.
The simplest way to monitor multiple inputs is to trigger when any one of them meets a specified condition. However, there are applications that require a more selective approach. For example, we might want to detect when both inputs meet specified conditions at the same time. PicoScope solves this problem by offering a list of logical functions for combining inputs.
If you plug in a PicoScope mixed-signal oscilloscope (MSO), the software will provide another triggering type called ‘Digital’. This behaves as a separate input to the Logic trigger function. For further information on the MSO Logic trigger, see the PicoScope 6 User’s Guide.

PicoScope for macOS is a powerful oscilloscope application that works with all PicoScope models. The most important features from PicoScope for Windows are included—scope, spectrum analyzer, advanced triggers, automated measurements, interactive zoom, persistence modes and signal generator control. More features are being added all the time.
Waveform captures can be saved for off-line analysis, and shared with PicoScope for Linux, PicoScope for macOS and PicoScope for Windows users, or exported in text, CSV and MathWorks MATLAB 4 formats.

Manchester encoding is a serial data signalling system originally developed at the University of Manchester for use on early generation computer systems with magnetic drum and 1600 bpi magnetic tape data storage devices. It is in widespread use today in network communication standards including 10BaseT Ethernet and MIL-STD-1553 as well as RFID, consumer IR devices and DALI lighting controls.
Manchester waveforms are “self-clocked”; the clock signal is embedded in the transmitted data using an exclusive-OR Boolean function. Embedding the clock means that only one signal line is required, rather than two or three that are needed with standards such as I2C and SPI.
More information on Manchester encoded signals – serial protocol decoding >>

Mask limit testing allows you to compare live signals against known good signals, and is designed for production and debugging environments. Simply capture a known good signal, draw a mask around it, and then attach the system under test. PicoScope will check for mask violations and perform pass/fail testing, capture intermittent glitches, and can show a failure count and other statistics in the Measurements window.
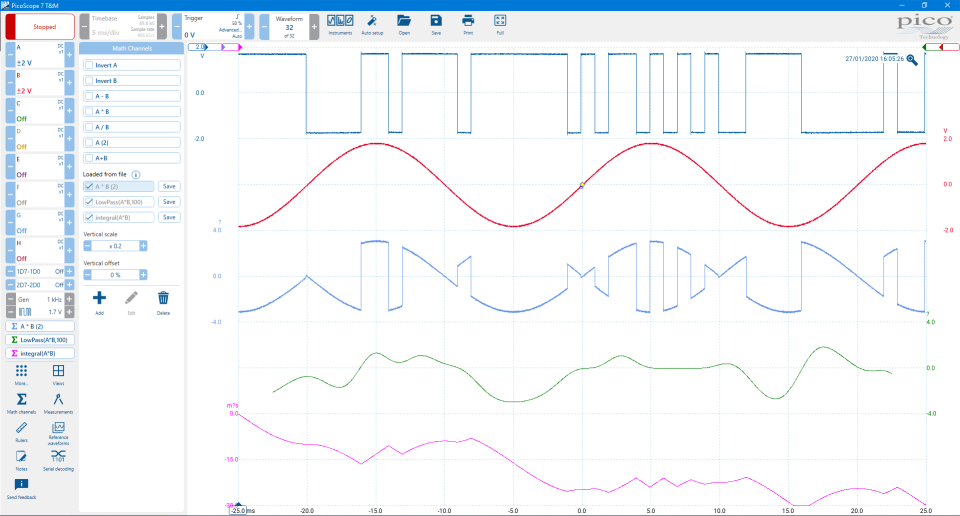
On many oscilloscopes waveform math just means simple calculations such as A + B. With a PicoScope it means much, much more.
With PicoScope software you can select simple functions such as addition and inversion, or open the equation editor to create complex functions involving filters (lowpass, highpass, bandpass and bandstop filters), trigonometry, exponentials, logarithms, statistics, integrals and derivatives.
Waveform math also allows you to plot live signals alongside historic peak, averaged or filtered waveforms.
You can also use math channels to reveal new details in complex signals. An example would be to graph the changing duty cycle or frequency of your signal over time.

PicoScope 7 provides many built-in, pre-defined measurements that can be applied to waveforms displayed on the graph. Advanced DSP technology ensues that the measurements are made with high accuracy and repeatability.
Furthermore, if the DUT waveform characteristics change over time, the measurements track and display current results based on the live waveform.
Statistics can be displayed to show Average, Mean, Maximum, Minimum and Standard Deviation values for the duration of a test.

Mixed signal oscilloscopes are standard oscilloscopes with added digital channel inputs.
Many PicoScopes have corresponding MSO versions which provide up to 16 digital channels in addition to the analog channels.
The digital channels are displayed individually and/or grouped together in a bus display, all time correlated with the analog channels around the same trigger point.
")
FATEC B1z-14MR PLC
Modbus is a low-speed serial data protocol, commonly used in industrial applications where a supervisory computer (master) controls or monitors multiple remote devices (slaves).
The specification was originally published in 1979 by Modicon (now Schneider Electric) for use with its programmable logic controllers (PLCs).
In a standard Modbus network there is one master, and up to 247 slaves each with a unique address from 1 to 247.
PicoScope (Beta) software provides support for Modbus RTU and Modbus ASCII.

NMEA (National Marine Electronics Association) 0183 is a UART-based protocol that has been in use since 1983. Originally developed for marine applications, it can now be found in other varying applications such as GPS devices. It utilizes a sentence structure to send its messages and displays them in human-readable ASCII text strings - each sentence consists of a ‘$’ to indicate the start of a message, followed by a 2-character talker identifier, 3-character sentence identifier, relevant data fields specific to the sentence ID and then an optional checksum (denoted by ‘*’ followed by a 2-character hex checksum) before terminating the message with ‘<CR><LF>’ (carriage return and line feed). Each field in the sentence is separated by a comma. Note that some manufacturers utilize proprietary sentence structures which may deviate from the specification.

Noise is any unwanted signal added to a wanted signal. These unwanted signals arise from a variety of sources which may be considered in one of two main categories:
Interference arises in communication systems from many sources due to crosstalk: 50/60 Hz supplies (causing hum) and harmonics, switched mode power supplies, thyristor circuits, ignition (car spark plugs) motors, etc.
Naturally occurring external noise sources include atmosphere disturbance (e.g. electric storms, lighting, ionospheric effect), and so-called sky noise or cosmic noise.
Thermal noise is electronic noise generated by the thermal agitation of the charge carriers inside an electrical conductor. Thermal noise in a resistor is of a type called white noise, meaning that its power spectral density is nearly constant throughout the frequency spectrum.
PicoScope has a white noise generator to help circuit designers evaluate noise immunity in their designs.

1-Wire is a serial communications bus system developed by Dallas Semiconductor Corp (now Maxim Integrated Products, Inc.) It provides low-speed data, signaling, and power over a single line. 1-Wire is similar in concept to I²C, but with lower data rates and longer range.
A typical network consists of a single master device connected to one or more slaves. Communication is bidirectional half-duplex, bit-sequential, with the LSB transmitted first. Speeds of 16 kbit/s Standard Mode, and 142 kbit/s Overdrive Mode are supported. Each slave is programmed with a unique ID, which allows configuration of multiple slave devices. The Master device can interrogate the network to discover what slave devices are connected and obtain their IDs.
Communication is initiated and controlled by the Master, typically through an open drain bidirectional port pin. When idle the 1-Wire line is pulled up to the 3 V or 5 V supply voltage with a resistor. Most 1-Wire slave devices are parasitically powered. Power for device operation is derived from an internal power storage capacitor that stores charge when the 1-Wire line is in the idle high state.
Communication is done with controlled short pulses, or “time slots”.
PicoScope's serial decoding feature can decode 1-Wire data as well as over a dozen other protocols.

PicoScope enables sharing of instrument settings, waveforms and measurement data with PSDATA files that can be saved by a user and loaded by other users running PicoScope software on their own PC.
PicoScope software is free of charge and can be run on Microsoft Windows-based PCs and tablets, Linux and macOS platforms. Off-line analysis delivers the full visualization, measurement, and documentation capabilities found on PicoScope oscilloscopes to engineers who are doing their work away from the lab.
To speed up analysis and to help get started at the right place, the PSDATA file loads the acquired waveform(s) and restores all the instrument display and measurement settings. Powerful visualizations include multi-viewport waveform displays with interactions for zooming, rulers, and notes, along with advanced waveform math.
PSDATA files can be saved with any PicoScope real-time oscilloscope.

An overshoot is a short term spike or transient in a waveform which rises above the Top or drops below the Base levels of a waveform. Typically an overshoot occurs at the top of a fast rising edge or at the bottom of a fast falling edge, like we see in a squarewave.
An overshoot on a rising edge will typically rise for a very short time (relative to the pulse width) above the Top level then may oscillate or ‘ring’ with reducing amplitude above and below the Top level, until finally settling at the Top level. This is called a Positive overshoot.
Similarly, an overshoot on a falling edge will typically fall for a very short time below the Base level then oscillate about the Base level until finally settling at the Base level. This is called a Negative overshoot.
In the article below is a demonstration of how to setup the Automated Measurement and Math channel for Overshoot.
More information on Overshoot - Measurement and Math channels >>

Advanced persistence display modes allow you to collect thousands of waveforms per second. New or more frequent data can be displayed in a brighter color or shade. This makes it easy to see glitches and dropouts and to estimate their relative frequency. Choose between analog persistence, digital color, fast or custom display modes.

Phase is an angular representation of a point, within a periodic waveform cycle. More specifically a complete cycle/period will be represented by 360° (2π radians or some other rotational unit) and phase is a fraction of this overall value, describing how much of the period has elapsed.

Phase rulers (called rotation rulers in PicoScope Automotive) are a set of lines that can be drawn over a scope trace to help measure phase angles. This is particularly useful for analyzing rotating machines and AC power waveforms.
Phase rulers can be displayed by clicking More > Rulers and switch Phase rulers to the On position, then drag the start and end rulers to the desired width. From this menu you can change the full cycle boundaries to 360°, 720°, 100% or a custom range. You can also add partitions to divide up the full cycle to show 90°, 180° and 270° as points to highlight.

Power Management Bus (PMBus) is a serial communications protocol aimed at the configuration, control, and monitoring of power supply devices. The System Management Interface Forum (SMIF) owns and maintains the standard.
PMBus operates over an SMBus physical layer, which is a low-cost two-wire bus largely derived from I²C, providing additional control signals. The resultant protocol provides a comprehensive set of power supply management and fault reporting commands.
A PMBus configuration consists of a single bus master and one or more slave power supply devices. The bus master may be a dedicated PMBus controller, microcontroller, FPGA, or an automated-test-equipment (ATE). A potential slave device may be an AC-DC or DC-DC power supply, Point-of-Load (PoL) converter, or a microprocessor power supply.

Recall that true power is power converted to useful output, delivered to a load. Apparent power is total electrical power present in an AC circuit or system and consists of both true and reactive power components.
Power factor is the ratio between true and apparent power, which is a measure of an electrical network's operational efficiency.
More information on Power factor measurement and math channel >>

Power factor is a dimensionless quantity that reflects the ratio of true power to apparent power in an AC electrical system. Apparent power is the vector sum of true power and reactive power, often represented by the product of voltage and current magnitude.

To minimize capacitive loading on the device under test, most probes use a 10:1 attenuator. This can often be adjusted, or compensated, to improve the frequency response.
The probe should be adjusted to compensate for the specific oscilloscope channel that you are using. To do this connect the probe to a 1 kHz square wave calibration source and use a non-magnetic adjustment tool to adjust the compensation network to obtain a waveform display that has flat tops with no overshoot or rounding.
An uncompensated probe can lead to measurement errors, especially in measuring pulse rise or fall times.

Figure 4: Low-frequency compensation
For more information, see the application note "How to compensate 10:1 oscilloscope probes".

Oscilloscopes with more than two channels present humans with a common problem: none of us have enough hands to hold more than two oscilloscope probes in place. This is especially an issue when using an 8-channel oscilloscope such as the new PicoScope 6800E devices, so it was particularly important for Pico Technology to address it.
Watch this short comic strip, This is Dave, to see how one engineer solves the age old problem.
For more information, see our Probe Positioner product page.

PSI5 captured trace in PicoScope 7
PSI5 (Peripheral Sensor Interface 5) is a standardized serial communication protocol commonly used in the automotive industry for connecting sensors and actuators to an Engine Control Unit (ECU) or other control systems in vehicles.
PSI5 is a two-wire interface using the same lines for power supply and data transmission. Data transmissions and synchronization control from the controller to the sensor are accomplished via modulation of the supply voltage. Data transmissions from the device back to the controller are accomplished via modulation of the current on the power supply line.
The following A-Z article will go into more technical detail on PSI5 and discuss how to capture and decode PSI5 frames in PicoScope.
Quadrature encoding is used by rotary position sensors to transmit information about the angle and direction of a rotating shaft, for example on a motor or a control dial, as a pair of binary signals. Now you can decode these signals just by downloading a free copy of PicoScope 6.14.48 or later.
PicoScope displays the decoded information in the same window as the raw signals so you can analyze timings and spot any problems. It's easy to set up: just go to Tools > Serial Decoding and choose Quadrature as the signal format.

Rapid trigger mode allows you to segment the PicoScope buffer memory and make acquisitions to successive segments with minimum delay between each acquisition. As the scope does not communicate with the PC between captures, this reduces the gap from milliseconds to less than a few microseconds, at the fastest sampling rates.
After capture of the number of requested segments set by the user the acquisition process halts and you can scroll through captured waveforms in the usual way using the buffer navigation buttons.


In an AC power transmission system, reactive power is the component of power that oscillates between the source and load without being consumed, whereas true power is the component consumed by various loads hence performing useful work. Some reactive power is necessary in the system to ensure functional operation and to maintain stable voltage levels.
When inductive loads are utilised (e.g. motors and transformers), a current lag occurs, causing a voltage drop, which is compensated for by reactive power, which supplies the necessary current.
Conversely when a capacitive load is utilised, a leading current is generated, which can cause higher voltages. Again reactive power compensates for this by absorbing the excess voltage and allowing the system to stabilise.
For more information on leading and lagging current, see Power measurements concepts.
More information on Reactive power measurement and math channel >>

With PicoScope you can display stored waveforms alongside live traces. You can apply all the same functions to the reference waveforms as you can to live waveforms, such as automatic and manual measurements, scaling and offset, and exporting to a file. Reference waveforms are especially useful for production testing and diagnostics, where they allow you to compare waveforms from the equipment under test with known good waveforms.
You can also shift the timebase of a reference waveform relative to live waveform data: click the color-coded axis control button at the bottom of the y axis for the reference waveform and adjust the box marked ‘Delay’.
Resolution enhancement is a technique for increasing the effective vertical resolution of the scope at the expense of high-frequency detail. It is useful for resolving small signal details and for reducing unwanted noise. Unlike waveform averaging it can be used on single-shot signals.

Rise and fall time measurements are commonly used when validating the signal integrity of square waves, pulses, and clocks in digital systems. Rise time characteristics are important in electronics because they indicate the ability of a circuit to respond to fast input signals.
As a rule of thumb, the following formula can be used to estimate the rise time of an oscilloscope:
tR = 0.35 / BW
where tR is rise time and BW is bandwidth of the oscilloscope.
So, for a 100 MHz oscilloscope the rise time can be calculated as:
tR = 0.35 / 100 MHz = 3.5 ns
The 0.35 relationship between bandwidth and rise time assumes a single-pole resistor-capacitor (RC) roll-off response of the oscilloscope and 10%-90% rise time measurement. Real-world examples may differ, especially at high frequencies, where the constant can reach 0.45 or higher.

Rise/Fall time trigger, can also be referred to as Slope or Slew rate trigger. This trigger measures the time the signal takes to transition between two voltage thresholds: from a lower threshold to an upper threshold in the case of rise time, or the opposite in the case of fall time.
The scope triggers when the measured transition time meets a user-specified time condition: greater than, less than, inside a range or outside a range of times. Unlike window pulse width trigger, rise/fall-time trigger allows you to trigger specifically on rising edges or on falling edges which meet a time condition. This can be useful if the expected slew rate of rising and falling edges is different in your system.

RS-232 is a standard for serial data communication first defined in 1962 by the Electronic Industries Alliance for use with data communication devices such as teletypewriters. Later, personal computers and other devices made use of the RS-232 standard for connection to peripheral devices such as modems, mice, keyboards, etc. In recent years RS-232 has become increasingly displaced by USB in modern PCs, though the standard, and many variants, are still widely used in industrial machines, networking equipment and scientific instruments.

Sampler Extended Real Time Oscilloscopes (SXRTO) are a new type of oscilloscope that offer the capability to capture and view extremely high-bandwidth signals in high vertical and horizontal resolution without the cost of a typical high-performance DSO or the measurement compromises of a sampling oscilloscope.
An SXRTO operates in real-time at low frequencies, and uses Equivalent Time Sampling (ETS) to deliver high effective sampling rates that are needed to match the instrument’s maximum analog bandwidth.
Operation and control of an SXRTO is similar to a conventional DSO; connect your signals to the respective input channels, choose one of them as the trigger source, and set the vertical and horizontal and controls as needed to display the waveforms.
More information on Sampler Extended Real Time Oscilloscope (SXRTO) >>

Scope view is the default mode of PicoScope. All the software's basic and advanced features can be accessed from here. As you can see, most of the display is dedicated to the most important feature: your signal.
The menu bar takes you to advanced functions such as serial decoding, reference waveforms, alarms and mask limit testing.
The top toolbars reveal yet more functions including spectrum and persistence modes, the buffer navigator and zoom tools, channel setup, custom probes and the signal generator/arbitrary waveform generator.
Finally, the lower toolbar contains essential controls such as start/stop, basic and advanced triggering, measurements and rulers.

SENT (Single Edge Nibble Transmission), SAE standard J2716, is a one way, point-to-point protocol for transmission of signal values from sensors to a controller. It is used mainly in automotive applications and enables reliable transmission of high-resolution data with lower cost than standards such as CAN, and higher bit rate than LIN.
Data is transmitted in units of 4 bits (1 nibble), for which the time is measured between falling edges (single edge) of the modulated signal. Nibbles are assembled into message frames that typically contain two 12-bit data words although other options are also possible, such as 16 bits for signal 1 and 8 bits for signal 2.
SENT data format is determined by what is best suited to the application. Once the format and data set have been selected, it is usually fixed in the design or configured with nonvolatile memory so that the data is continually transmitted on power up.

SENT SPC (single-edge nibble transmission short PWM code) is a half-duplex variation of the SENT protocol defined by Infineon Technologies AG. It is an extension of the SAE J2716 SENT protocol. It allows on-demand transmission of a single SENT frame by a sensor in the event a controller initiates the transfer of data, by sending a master trigger pulse (MTP).
PicoScope can decode 1-Wire, ARINC 429, BroadR-Reach (100BASE-T1), CAN & CAN FD, CAN J1939, CAN XL, DALI, DCC, DMX512, Ethernet 10Base-T and Ethernet 100Base-TX, FlexRay, I²C, I²S, I3C, LIN, Manchester, MIL-STD-1553, Modbus (ASCII/RTU), Parallel Bus, PMBus, PS/2, Quadrature, SENT Fast/Slow, SMBus, SBS Data, SPI-MISO/MOSI, SDI-SDIO, UART (RS-232 / RS-422 / RS-485), USB and Wind Sensor protocol data as standard, with more protocols in development, and available in the future with free-of-charge software upgrades.
Graph format shows the decoded data (in hex, binary, decimal, or ASCII) in a data bus timing format, beneath the waveform on a common time axis, with error frames marked in red. These frames can be zoomed in to investigate noise or signal integrity issues.
Table format shows a list of the decoded frames, including the data and all flags and identifiers. You can set up filtering conditions to display only the frames you are interested in or search for frames with specified properties. The statistics option reveals more detail about the physical layer such as frame times and voltage levels. PicoScope can also import a spreadsheet to decode the data into user-defined text strings.
More information on Serial bus decoding and protocol analysis - overview >>

A signal generator is an invaluable piece of test equipment. The output from a signal generator is a repeating waveform whose characteristics are set by the user. Signal generators can be used for research and development purposes, along with the servicing and repair of electronic equipment.
Most PicoScope PC oscilloscopes include an integrated signal generator. The signal generator is controlled using the PicoScope software.

Most oscilloscopes are built down to a price. PicoScopes are built up to a specification.
Careful front-end design and shielding reduces noise, crosstalk and harmonic distortion. Years of oscilloscope design experience can be seen in improved bandwidth flatness and low distortion.
We are proud of the dynamic performance of our products and, unlike most oscilloscope manufacturers, we publish our specifications in detail. The result is simple: when you probe a circuit, you can trust in the waveform you see on the screen.

In addition to the PicoScope application software, the PicoScope Software Development Kit (SDK) is available free of charge.
The SDK allows you to write your own software and includes drivers for Windows, macOS and Linux (including beta versions for Raspberry Pi and Beaglebone).
Example code, hosted on the Pico Technology GitHub pages, shows how to interface to third-party software packages such as Microsoft Excel, National Instruments LabVIEW and MathWorks MATLAB and programming languages including:
The drivers support USB data streaming, a mode that captures gap-free continuous data over USB direct to the PC’s RAM or hard disk at rates of up to 156.25 MS/s for USB 3.0 devices. Capture size is limited only by available PC storage. Sampling rates in streaming mode are subject to PC specifications, product specifications and application loading.

Increasing the number of points in a FFT to 1 million increases frequency resolution and reduces the noise floor.
The spectrum view plots amplitude against frequency and is ideal for finding noise, crosstalk or distortion in signals. The spectrum analyzer in PicoScope is of the Fast Fourier Transform (FFT) type which, unlike a traditional swept spectrum analyzer, can display the spectrum of a single, non-repeating waveform.
A full range of settings gives you control over the number of spectrum bands (FFT bins), window types, scaling (including log/log) and display modes (instantaneous, average, or peak-hold).
You can display multiple spectrum views alongside oscilloscope views of the same data. A comprehensive set of automatic frequency-domain measurements can be added to the display, including THD, THD+N, SNR, SINAD and IMD. A mask limit test can be applied to a spectrum and you can even use the AWG and spectrum mode together to perform swept scalar network analysis.

SPI (Serial Peripheral Interface) bus was originally developed by Motorola for use with their microcontrollers. Due to the simplicity of the bus, other manufacturers adopted it and it has become widely available in components used in embedded system designs. It is commonly used for chip-to-chip communications between a CPU and keyboard, display, ADCs and DACs, real-time clocks, EEPROM, SD and other memory devices.
SPI is a synchronous bus with four lines: Data - master output/slave input (MOSI) and master input/slave output (MISO), clock (SCLK), and slave select (SS or CS). SPI is a full duplex standard, meaning signals can be transmitted in both directions simultaneously, with data rates from a few Mb/s to tens of Mb/s.
Devices communicate using a master-slave architecture with a single master. The master device initiates the frame for reading and writing. Multiple slave devices can be addressed with individual slave select lines.

SPI waveforms can be decoded with PicoScope: From the Tools menu select Serial Decoding then Create and select SPI from the list of available protocols.

In this mode, data is passed directly to the host PC with buffering provided by the PicoScope internal buffer memory. This enables long periods of slow data collection for chart recorder and data-logging applications as well as fast USB streaming.
In PicoScope 6, the maximum number of samples that can be collected for each channel is 100 million. The Software Development Kit (SDK) allows unlimited data collection.
With faster scopes, both the speed of the USB connection and the amount of on-scope buffer memory may limit the fastest usable sampling rate.
Use streaming mode for:
Delay is the measure of time between equivalent reference points on two waveforms (usually rising or falling edges). This concept is closely related to phase, but the interval is measured in time, rather than an angle representing how much of the cycle has elapsed. Delay can be used to describe how long the waveform has taken to travel between these two points. To summarise, while they are related concepts, they represent different aspects of waveforms and are measured in different units.
More information on Time delay measurement and math channel >>
Top and Base are measures of the high and low levels of a signal, excluding any noise or ringing present on those levels. These differ from the Maximum and Minimum which do include any noise or ringing on those levels.
Amplitude measures the difference in the Top and Base measurements, giving you the total magnitude or strength of the electronic signal. In this case it is calculated as Top - Base.
More information on Top, Base & Amplitude - Measurement and Math Channels >>

The PicoScope 7 software and PicoScope oscilloscopes have a number of advanced trigger types that enable you to capture a stable waveform even with complex signals. This makes them ideal for troubleshooting glitches, timing violations, overvoltages and dropouts in analog and digital circuits.

True power represents the power converted to useful output, delivered to a load. True power is also referred to as the following: real, active, working, actual, useful, in-phase.
True power plays a crucial role in the efficient operation of electrical networks. To comprehend true power, it's essential to understand its relationship with apparent power and reactive power.
More information on True power measurement and math channel >>

Extended UART utilizes the core functionality of our standard UART/RS232 serial decoder and adds more utility. Whilst the standard decoder works by processing each packet and displaying them individually, the Extended UART decoder allows the grouping of data by searching for user-inputted start and end delimiters for a given UART 'message'. The user can input either the start delimiter, end delimiter, or a combination of both. This greatly improves the readability of the collected data in the table, whilst you can still see each individual packet on the graph display.

PicoScope lets you optionally share usage statistics with Pico to help us improve our software. Usage statistics help us prioritize features and device support. These usage statistics are anonymized and do not contain any personally identifiable information. Usage statistics include the following:
USB (Universal Serial Bus) is widely adopted in today’s personal computers and tablets for communication and power to printers, keyboard, mice, memory devices and many other peripherals. It is also used for chip-to-chip and module-to-module communication in many other types of electronic devices and embedded systems.

PicoScope can decode USB Low Speed and Full Speed waveforms: From the Tools menu select Serial Decoding then Create, and select USB from the list of available protocols.

PicoScope oscilloscopes can be powered from a variety of sources. Many models can be powered directly from the USB connection, while the highest-performance models require an external AC adaptor.
Some models can operate with USB power with two channels turned on, but require an AC adaptor to support four-channel operation.
When you plug in a flexible-power scope, PicoScope shows you a power options panel like this. The range of options depends on the capabilities of the scope.

Yes! You can use any PicoScope with a USB Type-C port. Connect it using the Pico blue USB cable supplied with the oscilloscope, in conjunction with a Pico TA285 USB Type-C to Standard-A (female) adaptor.

Vibration in mechanical systems, particularly with rotating machinery, can be very problematic, creating unwanted noise or introducing stresses that can lead to catastrophic failures. Analyzing vibration can help to identify root causes and allow corrections to be made to improve reliability.
PicoScope 4000 Series high-resolution, and PicoScope 5000 Series flexible resolution oscilloscopes can be used to perform simple and effective vibration testing and analysis.

An important specification to understand when evaluating oscilloscope performance is the waveform update rate, which is expressed as waveforms per second. While the sample rate indicates how frequently the oscilloscope samples the input signal within one waveform, or cycle, the waveform capture rate refers to how quickly an oscilloscope acquires waveforms.
Oscilloscopes with high waveform capture rates provide better visual insight into signal behavior and dramatically increase the probability that the oscilloscope will quickly capture transient anomalies such as jitter, runt pulses and glitches – that you may not even know exist.

PicoScope deep memory oscilloscopes use hardware acceleration to achieve over 100 000 waveforms per second.

In PicoScope, waveform averaging is a mathematical function that computes the average of a sequence of waveforms. This is useful for removing noise from a repetitive signal. The result of averaging is a cleaner picture with the same frequency resolution as the original capture but with increased vertical resolution.
The example opposite shows the result of waveform averaging on a noisy square wave. The lower waveform is the raw signal. The upper waveform is the cleaned-up signal at the same scale factor. Despite the reduction in noise this waveform has a large amount of high-frequency detail, giving us an accurate picture of the original pulse shape.
The waveform buffer toolbar at the top of the window shows that PicoScope captured 32 waveforms to create the averaged result. It is also possible to run PicoScope in a continuous averaging mode, in which the displayed waveform is the time-weighted average of all previous waveforms.

PicoScope Waveform Navigator
Ever spotted a glitch on a waveform, but by the time you’ve stopped the scope it has gone? With PicoScope you no longer need to worry about missing glitches or other transient events. PicoScope can store the last ten thousand oscilloscope or spectrum waveforms in its circular waveform buffer.
When the trace length is set to be shorter than the scope’s memory, PicoScope will automatically configure the memory as a circular buffer storing as many as ten thousand waveforms.
The buffer navigator provides an efficient way of navigating and searching through waveforms effectively letting you turn back time. Tools such as mask limit testing can also be used to scan through each waveform in the buffer looking for mask violations.

Wind sensors, generally consisting of a rotary, ultrasonic, or hot-wire anemometer, and wind vane, provide wind speed and direction information for many applications including boats, wind turbines, and weather monitoring.
Wind sensors are increasing in popularity with these growing technologies. Many sensors in these applications communicate via a serial interface using the NMEA (National Marine Electronics Association) 0183 protocol. This protocol has several features which make it suitable for these applications.
More information on Wind sensor - serial protocol decoding >>

PicoScope is the standard in PC Oscilloscope software – a complete test and measurement lab in one easy-to-use application.
PicoScope for Windows works with all PicoScope models. Oscilloscope, spectrum analyzer, advanced triggers, automated measurements, interactive zoom, persistence modes, maths channels, mask testing, serial bus decoding and analysis, and signal generator control are all included as standard. More features are being added all the time.

Developers working on IT and embedded system software projects commonly work in distributed teams that spread far away from their operational headquarters. High-speed internet access, secure VPN technology and advanced project management tools have enabled home working for many software engineers – a trend that has accelerated recently as a result of the current coronavirus lockdown.
But what about engineers who are working on hardware development?

An XY view, in its simplest form, shows a graph of one channel plotted against another. XY display mode is useful for showing relationships between periodic signals (using Lissajous figures) and for plotting I–V (current-voltage) characteristics of electronic components.

Many PicoScope oscilloscopes have deep buffer memory, which allows them to sustain high sampling rates across long timebases. For example, with a 512 MS buffer the PicoScope 3206D and 3406D models can sample at 1 GS/s all the way down to 50 ms/div to give a total capture time of 500 ms. Powerful tools such as the zoom function enable you to navigate and examine all the waveform data in detail. The zoom overview window allows you to easily control the size and location of the zoom area by just clicking and dragging.
The PicoScope multi-viewport display system builds on this by allowing you to see an overview of the captured waveform in one viewport and, simultaneously, detailed views of different parts of the waveform in other viewports.


