PicoScope 7 Software
Available on Windows, Mac and Linux

Maybe you’re measuring the temperature of a microbiological culture in an incubator, or strain on a concrete bridge in high winds; you’ll need to be informed when a reading exceeds acceptable tolerances. In PicoLog 6, you can set up an alarm to alert users when a parameter goes out of range. This can be configured to play a sound, display visual alerts on the screen, run a specified application such as an email or SMS client, and automatically annotate the capture graph to mark when the alarm happened and its duration.

Transferring capture data from a data logger or oscilloscope software application to a 3rd party application while the capture is running has been one of the longest outstanding customer feature requests, and had been very difficult to implement up until this point. Now that PicoLog data resides on a server, we've developed a simple server-side API that can allows programmers to request the data in batches.
This feature is particularly useful to users who want to add extra functionality such as emailing alarms or captures, plotting data in a different way (fill tanks, throttle needle, large numerical displays), adding logger data to existing databases and much more!
More information on API: Stream live Cloud capture data to your application >>
Instead of using a single file to save your data, PicoLog 6 is continuously backing up the captured data to a robust database structure, protecting your data from corruption and loss. There is no need to save data to a file until the end of the capture, or unless you want to share your data with a colleague.

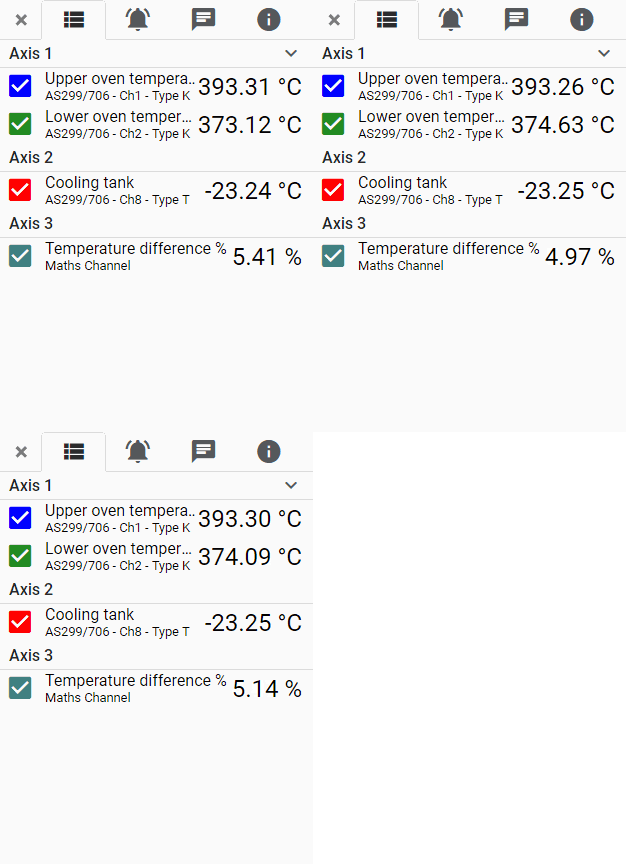
The Channel and Axes settings menu is visible in both the Device settings and Capture graph views. Once a channel is enabled and settings confirmed, you can view its connection status at a glance, along with alarm condition and current live measurement. In this menu, you can also configure alarms and view graph annotations and capture info.
In the event your host PC loses network connection during a capture, PicoLog Cloud instantly switches to use the PC's own hard drive until the network connection is restored. Any missing data will be promptly synchronised back up to the Cloud.
More information on Continuous capture, with or without network connection >>

When adding an alarm in PicoLog 6, you can choose from three methods of defining an alarm condition: threshold, channel disconnection and custom expression editor.
A custom expression for alarms in PicoLog 6 requires a Boolean output (true or false), which you can define using any combination of a wide range of arithmetic, Boolean, relational, statistical and trigonometric operators and constants.
At the heart of PicoLog 6 is a robust file system that is resistant to data loss and corruption. If the computer is shut down and rebooted, PicoLog resumes capturing without losing the previously stored data. Data is stored automatically without the need to provide a file name and location – but if you wish to save data to a file, you can, even in mid-capture. This makes it easy to share data with fellow PicoLog users.
The file system can store huge datasets limited only by the size of the hard disk or SSD on your computer!
Another major step forward is native support for 32-bit and 64-bit Windows, various Linux distributions (64-bit only) and macOS. The new .picolog file format is compatible across all operating systems. Since anyone can download and install PicoLog 6 for free, you can share saved .picolog files with co-workers, customers and suppliers for offline post-analysis.

If you don't yet have a PicoLog data logger, you can still use PicoLog 6 to view saved waveforms and try out its other features with the built-in demo mode.
You can enable up to three virtual instances of each PicoLog data logger with simulated live data. All the features of the PicoLog 6 software are then available for you to try before you buy.

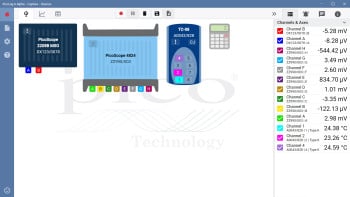
Within the Device setup and capture menu are the Device config, Graph display and Table views. These make it easy to set up and acquire data from a multichannel acquisition system, even with multiple different PicoLog data loggers and hundreds of channels. In the Device config view you can instantly see the status of data loggers, acquisition channel settings and math channel setup. Each detected device is depicted with its enabled channels. Simply move or copy device configurations to set up larger multiple-logger systems, swap out loggers during capture or share configurations.
From this screen you can view and adjust settings such as adding graph axes, per-channel scaling factor, alarms, notes, graph annotations, channel naming and color, sample mode and sample interval.

PicoLog 6 opens up possibilities never before possible with Pico data loggers and oscilloscopes. With sample rates up to 1 kS/s per channel (device-dependent), up to 20 devices connected at once, and a maximum of 16 channels per device (device-dependent), it is possible to capture a great deal of information from your sensors in fine detail. What's not to like?
As it happens, modern-day PCs are very capable at capturing and storing all your long-term captures, and much much more. With hard disk space now in the terabytes, you'd think that the days of managing disk space are over.
The in-depth article explains everything you need to know about large data captures, and disk usage on your PC.
More information on Disk usage when capturing with PicoLog 6 >>

When configuring input channels for an external sensor, it is often necessary to convert the output voltage signal from a sensor into the correct value and appropriate units for the sensor. For example, for a pressure sensor with a 1 V per 200 mbar output signal, you would need to multiply the input by 200 and set custom units of "mbar", or divide the input by 5 and set units of "bar".
The equation editor for channel scaling function in PicoLog 6 requires a numerical output, which you can define using any combination of a wide range of arithmetic, Boolean, relational, statistical and trigonometric operators and constants.
You've just taken delivery of a PT-104 or PicoLog CM3 data logger. Using it with its USB port is easy – just plug it in and run PicoLog 6. But what if you want to locate the device in a remote location away from your computer? This is where the Ethernet port comes in. PicoLog 6 includes a feature to help you set up the Ethernet port.

When you’re ready to export the data, you have several options. First, save the .picolog file and close the acquisition. You can save files with custom search tags to make them easier to categorize and locate later.
Exporting large datasets to CSV can often be troublesome due to file size limitations, so PicoLog 6 includes a suite of export options to narrow down the size of the whole dataset. These include downsampling, selecting channels to export or even restricting the export region to the zoomed area on screen.
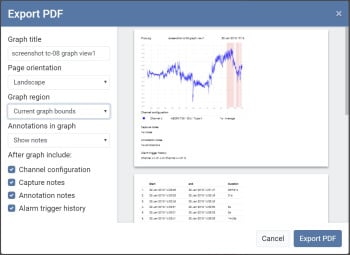
Want to export a screen shot? PicoLog 6 includes a feature to export the graph as a PDF: again, select either the entire capture or the zoomed area of interest. The export to PDF format also includes options to include alarm trigger history, annotations, channel configuration and capture notes, for a complete capture report.

Viewing your data in a graph is fundamental to data acquisition applications. The PicoLog 6 graph view makes it easy to view captures, zoom and pan through large datasets, record alarm history and display when alarms occurred. It also allows you to annotate the graph with your notes and observations.
Adding additional graph axes is also essential for multi-channel logging applications where measurement units are different for every channel, or when the channels are measuring values at opposite ends of the range. For example, simultaneously measuring an internal furnace temperature of over 1000 °C and the ambient temperature at the same time requires two axes so that the detail of both is visible. You can view up to four axes with different ranges at a time.

When configuring an alarm, you can tell PicoLog 6 to trigger an audible alert from your PC, a digital output from a compatible logger or a visual alert on the screen, but you can also run an external application using the "Run application" command line feature.
Very quickly, we can think of many interesting uses and ways to use this command line such as sending alerts via email, SMS messages, perhaps a Skype message and invoking a script or executable file. But you'll soon find yourself in hot water with your IT department, as there are fundamental security concerns over launching email clients and messaging services to automate sending an email alert from the command line, for good reason!
This article explores a simple, secure and completely free way of using the command line to send an email message or notification to your phone, without giving your IT team a heart attack or incurring additional costs.
More information on IFTTT enables PicoLog to send alarm notifications to your phone >>

Some applications require the recording and graphing of a calculated parameter containing data from one or more measurement channels. PicoLog 6 is equipped with an equation editor to perform simple calculations such as A–B, or more complex functions such as log, sqrt, abs, round, min, max, mean and median.
Math channels are treated like any normal channel, so you can perform functions like alarms, graphing and annotations on them.

So you’ve bought a Pico data logger and downloaded PicoLog 6, maybe to measure temperature using a TC-08 as part of design validation of an electronic device you are making. This will give you 8 channels of thermocouple logging which, to be honest, is enough for 60% of applications. What happens if your design grows in size and complexity, with more points to measure: do you buy another logger to use with another PC?
Read this article on expanding the number of instruments in PicoLog. It's easy to do.

Capture notes describe the entire dataset. They are typically used to record setup conditions and make general observations as the capture progresses.
Annotations refer to specific points that you select on the graph. Click the Add annotation button  to add a note and specify the direction of the callout.
Another really useful feature is that annotation history is recorded and listed in chronological order in the annotation pane. Clicking the Show in graph button  zooms into the event in the graph display. Annotations provide a useful way of leaving prompts, questions and discussion topics when sharing
 .picolog files with colleagues.
The annotation can also be edited with this button  , including position, user text, and call-out direction.
Annotations can also be permanently deleted with this button  .
.

Here is the list of updates and fixes in this latest release of PicoLog Cloud:

PicoLog 6 is a complete data acquisition software package. It provides a visual, easy-to-use interface allowing you to quickly set up simple or complex acquisitions and record, view and analyze data.

Pico Technology data loggers work great when USB connected to PCs running Windows, macOS and Linux, and now with support for Raspbian OS on armhf processors, we support Raspberry Pi computers.
Optimized and tested on the new Raspberry Pi 4 on Raspbian Buster, the PicoLog 6 data logging software package provides a visual, easy-to-use interface allowing you to quickly set up simple or complex acquisitions and record, view and analyze data. It's the same fully functioning software that runs on Windows, macOS and Linux.
Coupled with a Raspberry Pi, this new PicoLog 6 package expands the flexibility and opens the door for Pico's data loggers to be used in new and different ways:
More information on Raspberry Pi extends data logger capability >>

Security is at the top of the priority list with PicoLog Cloud, and we use the latest and greatest security techniques and processes to ensure your online data and credentials stay safe. To achieve this, PicoLog Cloud employs an Identity Management Platform to manage the login authentication process, keeping your identity anonymised and your data captures safely yours.
In today’s modern business, the health and performance of data servers and network infrastructure are vital every day. The cost to the business is can be considerable if something were to fail, and trust me, it often does. Failures are much more likely to occur if room temperatures are not kept cool. Read more about how Pico Technology solves this problem with PicoLog Cloud.
More information on Server room monitoring using PicoLog Cloud and the API >>
In this free upgrade to PicoLog data logging software, your Pico data logger or oscilloscope not only captures to a local disk, but now it can stream the capture directly to a secure online Cloud store. Did we mention our new cloud service is completely free for all new and existing customers?
This new major feature stays true to our vision of creating a data logging application with a simple user interface, and is equally straightforward for use by technical or non-technical users.
PicoLog Cloud is fundamentally the same application as before, but with enhancements to send the live capture data directly to your remote PicoLog Cloud space, and in addition view saved captures stored in the Cloud.
Table view is a useful new feature that allows you to view your data in a spreadsheet format. You can use it to view live data from your current dataset or data from your saved data files.
You can configure table view to show up to four statistical parameters for each channel: last sample, minimum, maximum and average. You can also specify the table update rate.


All thermocouples sold by Pico Technology are manufactured to strict industry tolerances, specifically IEC 60584-2:1993 / BS EN 60584-1:2013, to guarantee accuracy for any given thermocouple. This topic provides the IEC colour code, thermocouple material and tolerances for the 3 tolerance classes for Type B, E, J, K, N, R, S and T thermocouples. Temperatures are expressed in degrees Celsius.
Plugged into your PC or laptop, USB instruments have been harnessing the power of your computer's screen, processor, hard disk, keyboard and mouse for over 3 decades. There are very few limitations with this setup, but some users just can't be in the same room, factory, city or even country with their data capturing equipment.
Now, PicoLog Cloud opens a window into your loggers and captures allowing other PCs with PicoLog installed to view and export your data, from anywhere in the world. But don't worry, that PC must be signed into your personal PicoLog Cloud account to view any of your captures, live or saved.
More information on Data acquisition and logging - view live captures anywhere >>


PicoLog 6 has always been based on a framework that uses Chromium (Google's open-source browser) and Java meaning it is already "browser ready".
More information on Viewing cloud captures on a phone or tablet >>

A simple vertical menu bar on the left of the screen provides permanent access to the main program menus and view modes of PicoLog 6 without pausing capture.
The permanent vertical navigation bar gives access to the following menus:

When searching through datasets for events or trends, it's important to be able to navigate the data and pinpoint a data range to take a closer look. At Pico we feel it is essential to have zooming controls in easy reach at all times in the graph view: zoom in, zoom out, zoom selection and pan. In addition, mouse, touchpad and touchscreen gesture controls present a faster and smarter way to examine your data in detail.