PicoScope 7 Software
Available on Windows, Mac and Linux
A to Z of PC oscilloscopes
Everything you need to know about PC oscilloscopes from Advanced Triggers to Zooming.

A to Z of Data Loggers
Everything you need to know about PC-based data loggers from Alarms to Zooming.
Application Notes
Details of some of the many applications for Pico data logger and oscilloscope products.

How do I measure...?
Find out how you can measure using Pico products

Videos
Showing you how to get the most out of PicoScope oscilloscope software.

Documentation
Up-to-date versions of the documentation supplied with your products in PDF format.

Educational Experiments
Our library of science experiments suitable for use with oscilloscope and data logging products.

PicoApps
Want to share hints, tips and code with other developers? Show your Pico-based products to the world.

Newsletter
Archive of our monthly Test and Measurement Newsletters.

The traditional method of measuring wind turbine performance under laboratory conditions in ideal circumstances will always tend to be optimistic and rarely reflect how the turbine actually behaves in a real situation. Real performance will be affected by local wind conditions, nearby obstructions, power demand profiles and a range of other factors. There will also be deterioration in performance with time due to wear and tear. What is important is how the turbine reacts and actually delivers power on site. Without proper data this can be very subjective and a matter of personal opinion.
This application note focuses on collecting real-time power, rotor speed and wind speed data of a specific Proven WT2500 wind turbine that has been in almost continuous operation for 6 years. Information derived from these measurements can help decide whether maintenance is necessary. Further interpretation of the data could help optimise the wind turbine and could assess if it has been sited in the correct position.

In the Falkland Islands there are around 100 remote homes and farms with no access to the power grid. In 1996, a renewable energy programme was launched by the Falkland Islands Development Corporation and there are now more than 60 power systems in operation that use Proven wind turbines
The Proven range was originally chosen because of its rugged construction and ability to survive consistent high–speed winds, the average annual wind in the Falklands being in excess of 8.5 m/s. Small commercial wind turbines operating at relatively high rotation rates usually have a short lifetime and those that do not fail outright, suffer rapid leading edge blade erosion, therefore requiring regular blade repair or replacement. The relatively low operating speed of the Proven was considered as a factor that would improve its chances of long–term success. This has been substantiated as some Proven wind turbines have now been in operation for 10 years.
The Proven wind turbine is a downwind horizontal axis type. The rotor is constructed from three polypropylene blades each with two spring-loaded hinges at the blade root. This assembly is referred to as a Zebedee hinge and comprises an inner hinge (angled at 90 degrees) and an outer hinge (angled at 45 degrees). The two hinges work together to effectively twist the blade as an automatic passive blade pitch and power control system. The system is normally set to give a low angle of attack for easy starting at low wind speeds. As the turbine accelerates, centrifugal force causes the hinges to open. This flattens the blade, increasing the angle of attack to the relative airflow. The centrifugal force and therefore the pitch both increase with rotor speed. In high winds, the wind force on the blades overcomes the spring tension and the rotor disk cones, both stalling the blades and reducing the effective rotor disk area and therefore power output. An increase in shaft torque will cause the blades to oppose the action of the centrifugal force which will tend to close the hinges, decreasing the angle of attack.
The spring tension is factory-set to run at a maximum operating speed of 300 rpm (5 rev/s) at the rated 12 m/s wind speed and above. Wear at the spring mountings and loss of elasticity of the springs in use can cause stalling and coning to commence at lower wind speeds, reducing the maximum power output of the turbine.
The Proven wind turbine is a variable-speed three-phase permanent magnet alternator and consists of four-pole pairs rotating within 24 stator coils. Each coil nominally produces 30 volts and eight coils per phase are arranged during manufacture in series and parallel combinations to produce wind turbines generating 24, 48, 120 or 240 volts. The neutral is not accessible as a common point on production machines. The rating of 300 rpm with a four-pole-pairs generator produces a line frequency of 20 Hz.
In the case of the wind turbine at Port Louis farm, the owner had suspected that the turbine has been under-performing and offered it for these trials. Port Louis is an historic part of the Falklands and the last person to engage in any scientific work here was probably Charles Darwin in the 19th Century.
The choice of suitable sites for small wind turbines is usually limited by the cost of the heavy–duty power cable needed to carry the turbine power output to the charge controller and battery. Most of the turbines are sited within 100 metres of the powerhouse, which contains the battery bank, diesel generator, power inverter and wind turbine charge control panel. Turbine siting is always a compromise and can result in less than ideal winds. To reduce DC power losses in the power cables, most turbines in the Falklands operate at 48 V (50–60 A) but a few operate at 24 V (100–120 A).
The Port Louis WT2500 wind turbine was designed to generate 2.5 kW at 48 volts in a 12 m/s wind and is 110 metres from the powerhouse on a slight rise of land to the north west of the buildings. It has been sited so that is relatively unobstructed from the prevailing westerly winds. However, being relatively low to the ground on the standard 6.5 metre mast, the turbine receives more buffeting and turbulence than if it were mounted higher.
In order to gain enough data to obtain meaningful results, three details would have to be logged in real time:
The analysis would require instrumentation to measure 4 parameters:
A means of simultaneously measuring and recording this information in real time was devised based around the ADC-16 8-channel analogue to digital converter. The ADC-16 can measure DC signals from –2.5 to +2.5 volts DC. The PicoLog software allows scaling within the program so that correction, calibration and conversion factors can be applied automatically to the recordings on collection to minimise spreadsheet processing. Most data processing was performed using Microsoft Excel.
Additional circuitry was required for the signal processing so that measurements could be taken for turbine rotor speed and wind speed. New signal processing circuits were designed to maximise the working range of the ADC-16 interface to improve accuracy and precision.
Both turbine rotational speed and wind speed measurements were sensed as low-frequency AC waveforms. The Proven turbine maximum rotation speed of 300 rpm with a four-pole permanent magnet alternator produces an AC frequency of 20 Hz. Similarly, the output frequency of the anemometer at 20 m/s is 25.7 Hz. To convert an incoming AC signal into a DC voltage that could be recorded by the ADC-16, two similar frequency to voltage converters were constructed based on the LM 2917 integrated circuit (IC). Component values were calculated using the manufacturer’s datasheet to give an operating range of 0–25 Hz, which would be converted into an output of 0–2.5 volts to match the input range of the ADC-16.
The test equipment was connected to the Proven control panel, as shown below in Figure 1.

Figure 1: Connecting the sensors
A potential divider was constructed to drop the 48 volt DC line from the Proven control panel down to a measurable voltage.
This was measured using the existing Proven current shunt, which was designed to give a voltage of 50 mV at a current of 60 amperes.

Figure 2: Frequency to voltage converter
– Rotor speed measurement

Figure 3: Frequency to voltage converter
– Wind speed measurement
This was derived from one phase of the three-phase input to the wind turbine rectifier. A physical connection was made to one of the phases of the AC line from the wind turbine within the Proven control panel. A potential divider was designed to reduce the peak AC voltage to around 1.5 to 2 volt DC. As this was frequency measurement, the voltage was not critical. Figure 2 shows the frequency to voltage converter that was used to create a voltage for the ADC-16.
The sensor used was an NRG #40 anemometer head, an industry standard unit. This was mounted at hub height about 5 metres alongside the wind turbine perpendicular to the wind axis. The NRG #40 uses a small permanent magnet generator to produce an AC signal with the frequency proportional to the wind speed. The anemometer AC output was converted to a voltage using a frequency to voltage converter (Figure 3).
Ideally, the tests should have been applied to a wind turbine driving a constant impedance load. However, this was not an option as the power system was in full operation supplying a real load to the farm buildings and domestic accommodation. During the tests, the diesel generator was running supplying power and charging the battery. This helped stabilise the 48 volt DC voltage bus and minimised transient load impacts that would change load impedance and affect readings if operating on battery and wind only. The Proven dump load control system was deactivated during the tests.
The main measurements were all taken in one day when the wind steadily decreased from 13 to 6 m/s. The PicoLog software allowed some latitude in recording intervals, but typically a reading of all four parameters was taken every second and recorded in blocks of 500 seconds. As the anemometer was fixed on a lightweight portable telescopic mast, it was possible to change the position of the anemometer to maintain the relative positions if the wind changed.
The primary data was binned and averaged over different time blocks ranging from 5 seconds to 1 minute. This was to allow for delays in the response of the turbine due to the difference in inertia between itself and the anemometer. After examination, the data set using 30 second blocks was selected as the best option for further processing.

Figure 4: Overview of the entire test
A power versus wind plot was plotted in Figure 5 and the Proven WT2500 published power curve overlaid for comparison. This shows power versus wind speed for the entire run after the data had been averaged and binned in 30 second blocks.
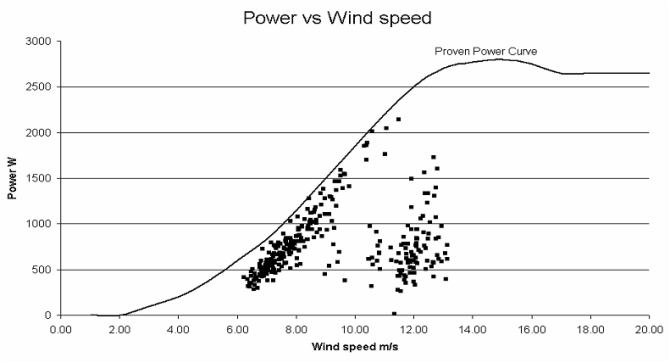
Figure 5: Recorded power and wind speed
Figure 6 compares wind speed and rotor speed for the same duration. Both graphs clearly show that there is severe over-regulation at wind speeds above 10 m/s that does not allow the wind turbine to reach its maximum power potential and it never reaches the rated speed of 5 rev/s (300 rpm).

Figure 6: Rotor speed and wind speed
Above 10 m/s, where power regulation caused blade coning, the early data recorded was erratic and use of these figures would distort further data processing. A cut off point was set at 3500 seconds and the readings taken before this point were not used for the detailed calculations. As the wind speed during the day did not fall below 6 m/s, and regulation cut in at 10 m/s, the final results were based on a narrow band of rotor speeds between 3.1 and 4.4 rev/s
The universal standard to assess the performance of a wind turbine is a plot of the Power Coefficient versus the Tip Speed Ratio performance curve. This curve tells you how efficiently a turbine converts the energy in the wind to electricity. Various methods were used to plot this curve. The results are show in Figure 7 below.

Figure 7: Power Coefficients versus Tip Speed Ratio
The Proven WT 2500 wind turbine is designed robustly to survive hard conditions in turbulent zones on a relatively short mast which is much nearer to the ground than other designs. As a result, it will encounter gusts and rapid but small changes in wind direction that cause it to continually accelerate, decelerate and oscillate noticeably around its yaw axis. Rarely does it run at a steady speed pointing directly into the wind.
During the tests, it was noted that the anemometer reacted very quickly to wind changes and was direction independent. On the other hand, the much greater inertia of the wind turbine would cause a delay in response in both rotation and yaw. The passive blade control mechanisms, by their nature will also lag slightly behind variations in the wind. The attitude of the blade angle due to the action of the Zebedee hinge, rotation speed and direction of yaw means that the wind turbine will rarely instantaneously match the theoretical maximum power generation values under real operating conditions. This contrasts sharply with wind tunnel tests where yaw and shear winds are not an issue and the turbine has time to settle down in between changes in loads or wind speed to present a stable set of readings reflecting its optimum performance.
It was thought that the wind turbine was underperforming prior to the test and these tests have proved this to be correct. Wind speeds in excess of 10 m/s produced an erratic power output from the turbine, well below the rated values.
As shown in Figure 7, the speed range 3.5 to 4.0 rev/s produced a higher power coefficient at a higher tip speed ratio than the other speed bands. Bearing in mind that these tests were performed on a wind turbine that was operating below par, the results seem to indicate that it is operating more efficiently in the middle speed range 3.5 to 4.0 rev/s.
Details of this application were kindly provided by Tim Cotter of the Falkland Islands Development Corporation, Stanley, Falkland Islands.


