PicoScope 7 Software
Available on Windows, Mac and Linux
A to Z of PC oscilloscopes
Everything you need to know about PC oscilloscopes from Advanced Triggers to Zooming.

A to Z of Data Loggers
Everything you need to know about PC-based data loggers from Alarms to Zooming.
Application Notes
Details of some of the many applications for Pico data logger and oscilloscope products.

How do I measure...?
Find out how you can measure using Pico products

Videos
Showing you how to get the most out of PicoScope oscilloscope software.

Documentation
Up-to-date versions of the documentation supplied with your products in PDF format.

Educational Experiments
Our library of science experiments suitable for use with oscilloscope and data logging products.

PicoApps
Want to share hints, tips and code with other developers? Show your Pico-based products to the world.

Newsletter
Archive of our monthly Test and Measurement Newsletters.

PicoScope® 2000 Series
Like a benchtop oscilloscope, only smaller and better


PicoScope has a large, high resolution display. The easy to use interface can be controlled by mouse, keyboard shortcuts or touchscreen.
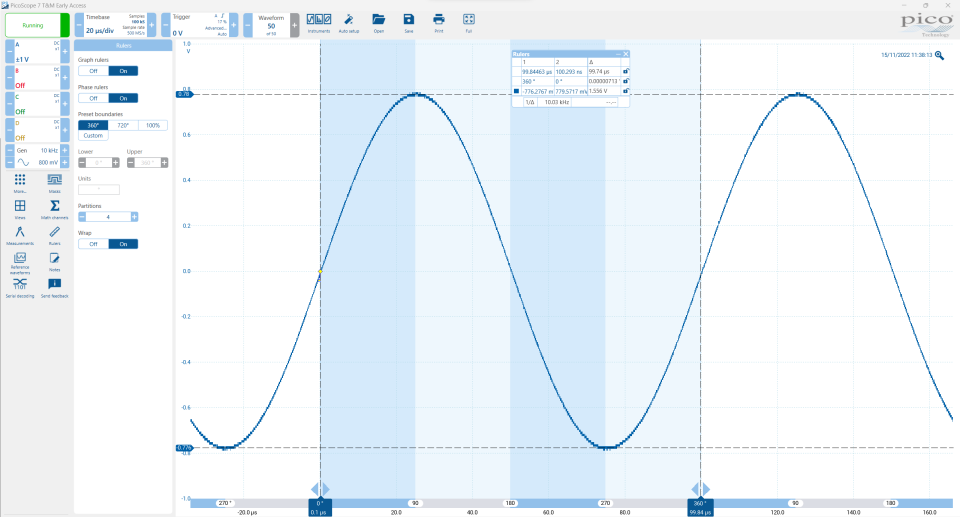
Each channel has independent draggable rulers for amplitude measurement. Vertical rulers can measure time, percent (for duty cycle) or phase in degrees.

Arbitrary waveform generator. Waveforms can be imported from the oscilloscope, spreadsheets or saved files. The graphical editor allows waveforms to be built from standard shapes or drawn by hand

Pass / fail mask limit tests can be added to oscilloscope and spectrum views. This allows a signal to be tested in both the time and frequency domain

Persistence display. Waveform update rates of upto 80000 per second help identify glitches. Infrequently occuring waveforms are shown in colder colors

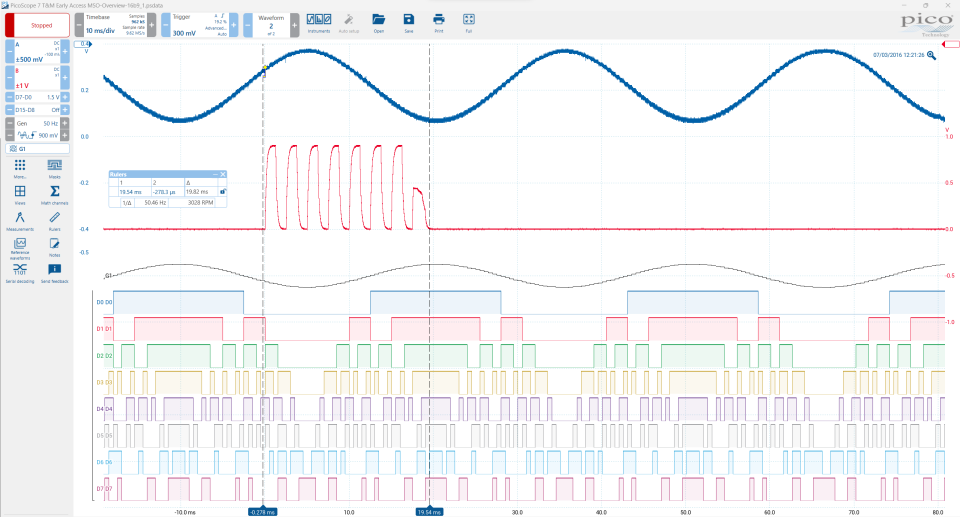
Mixed signal example. The blue trace is the input signal to an ADC. Digital channels monitor the ADC output. The green channel is a math channel re-constructing the ADC data (only most significant bits shown for clarity).

The top trace is a square wave input of varying frequency. The bottom trace is a graphing measurement of its frequency

Resolution enhancement. In this example the blue trace has been enhanced to 12 bits. This can be seen most clearly in the zoomed waveform.

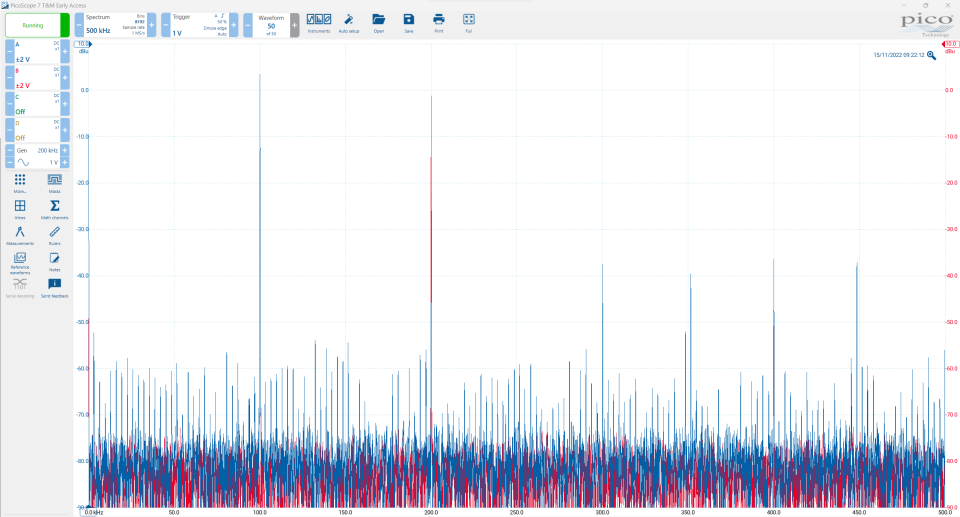
Spectrum view. Increasing the number of spectrum bins improves frequency resolution and reduces the noise floor. Options such as peak hold can be used with the signal generator to plot amplifier frequency response.

With PicoScope and the high resolution of a PC monitor you can have multiple scope and spectrum views at the same time

A wide range of advanced triggers are available. The trigger icon allows trigger level and pre/post trigger to be adjusted live on the waveform by mouse or touchscreen control


The measured signal (blue) has a significant amount of noise that has been removed by adding a software lowpass filter. This allows both the live and filtered signals to be viewed at the same time.
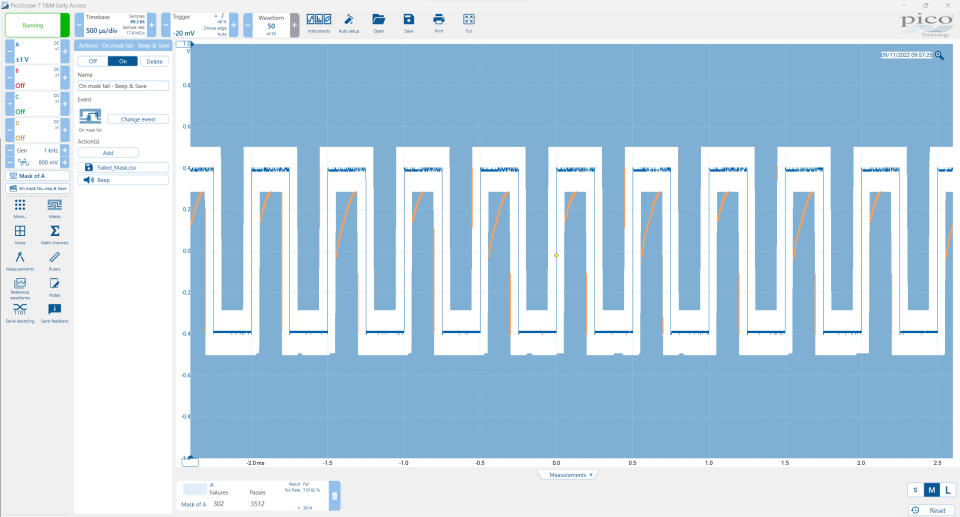
Alarms provides several actions that can occur when a waveform fails a mask test.
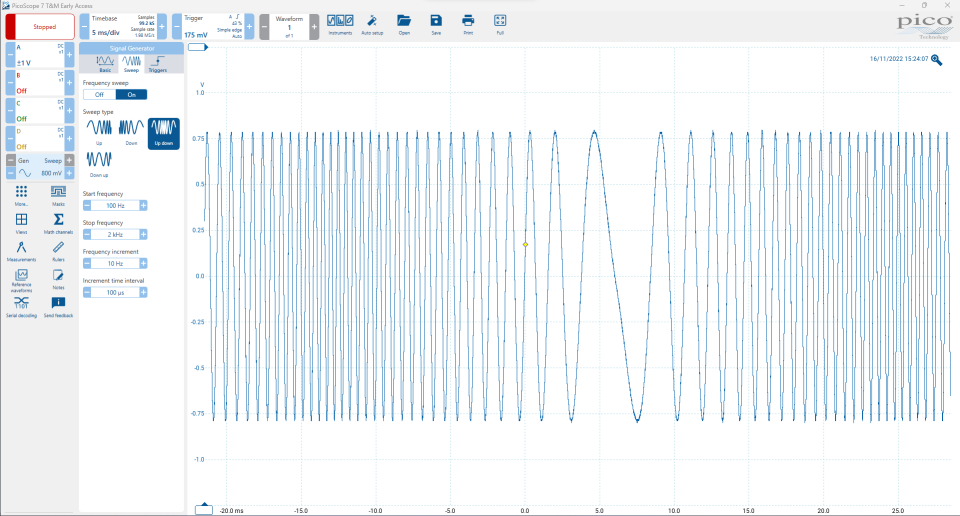
The signal generator has a dozen standard waveforms. Frequency, amplitude and offset can be set. Advanced options include frequency sweeping and the ability to output a number of waveform cycles on a trigger event

Mask limit testing allows you to compare live signals against known good signals, and is designed for production and debugging environments. Simply capture a known good signal, draw a mask around it, and then attach the system under test. PicoScope will check for mask violations and perform pass/fail testing, capture intermittent glitches, and can show a failure count and other statistics in the Measurements window.
On many oscilloscopes waveform math just means simple calculations such as A + B. With a PicoScope it means much, much more.
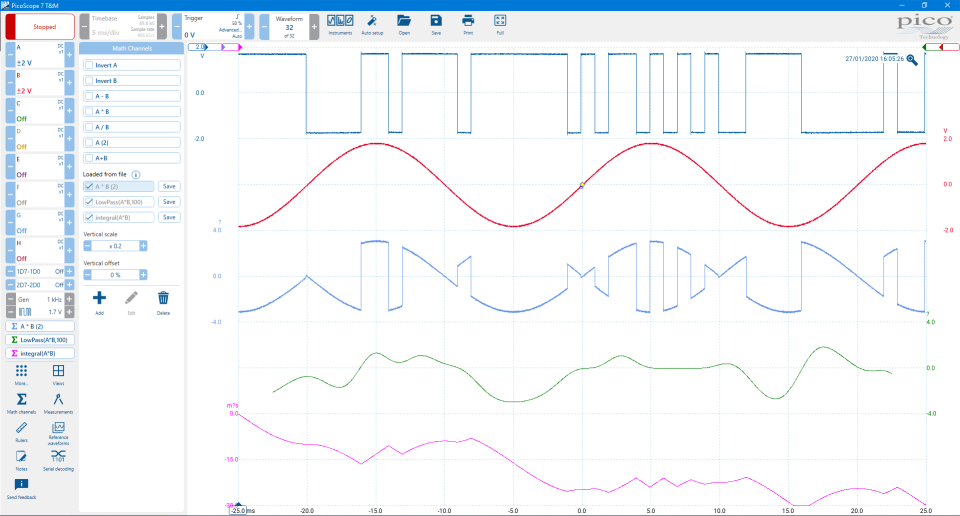
With PicoScope software you can select simple functions such as addition and inversion, or open the equation editor to create complex functions involving filters (lowpass, highpass, bandpass and bandstop filters), trigonometry, exponentials, logarithms, statistics, integrals and derivatives.
Waveform math also allows you to plot live signals alongside historic peak, averaged or filtered waveforms.
You can also use math channels to reveal new details in complex signals. An example would be to graph the changing duty cycle or frequency of your signal over time.

PicoScope Waveform Navigator
Ever spotted a glitch on a waveform, but by the time you’ve stopped the scope it has gone? With PicoScope you no longer need to worry about missing glitches or other transient events. PicoScope can store the last ten thousand oscilloscope or spectrum waveforms in its circular waveform buffer.
The buffer navigator provides an efficient way of navigating and searching through waveforms, effectively letting you turn back time. Tools such as mask limit testing can also be used to scan through each waveform in the buffer looking for mask violations.

PicoScope can be programmed to execute actions when certain events occur.
The events that can trigger an alarm include mask limit fails, trigger events and buffers full.
The actions that PicoScope can execute include saving a file, playing a sound, executing a program or triggering the signal generator / AWG.
Actions, coupled with mask limit testing, help create a powerful and time saving waveform monitoring tool. Capture a known good signal, auto generate a mask around it and then use the alarms to automatically save any waveform (complete with a time/date stamp) that does not meet specification.

Oscilloscopes with high waveform capture rates provide better visual insight into signal behavior and dramatically increase the probability that the oscilloscope will quickly capture transient anomalies such as jitter, runt pulses and glitches – that you may not even know exist.
The PicoScope 2000A models can capture up to 2000 waveforms per second, whilst the 2000B models use hardware acceleration to boost this to 80 000 waveforms per second. In both cases these are the fastest waveform update rates available at this price point.

PicoScope 2000B model oscilloscopes have waveform buffer sizes up to 128 million samples – many times larger than competing scopes of either PC-based or traditional benchtop design.
Deep memory produces several benefits: fast sampling at long timebases, timebase, zoom, and memory segmentation to let you capture a sequence of events. Deep memory oscilloscopes are also ideal for serial decoding applications as they allow the capture of many thousands of frames of data.
Most other scopes with large buffers slow down when using deep memory, so you have to manually adjust the buffer size to suit each application. You don’t have to worry about this with PicoScope deep-memory scopes as hardware acceleration ensures you can always use deep memory while displaying at full speed.
The lower cost / bandwidth PicoScope 2000A models have smaller internal memories but when sampling at rates of less than 1 MS/s use USB streaming and PC memory to provide a 100 million sample buffer.

The majority of digital oscilloscopes still use an analog trigger architecture based on comparators. This causes time and amplitude errors that cannot always be calibrated out and often limits the trigger sensitivity at high bandwidths.
In 1991 Pico pioneered the use of fully digital triggering using the actual digitized data. This technique reduces trigger errors and allows our oscilloscopes to trigger on the smallest signals, even at the full bandwidth. Trigger levels and hysteresis can be set with high precision and resolution.
The reduced rearm delay provided by digital triggering, together with segmented memory, allows the capture of events that happen in rapid sequence. On many of our products, rapid triggering can capture a new waveform every microsecond until the buffer is full.

PicoScope 7 provides many built-in, pre-defined measurements that can be applied to waveforms displayed on the graph. Advanced DSP technology ensues that the measurements are made with high accuracy and repeatability.
Furthermore, if the DUT waveform characteristics change over time, the measurements track and display current results based on the live waveform.
Statistics can be displayed to show Average, Mean, Maximum, Minimum and Standard Deviation values for the duration of a test.

With PicoScope you can display stored waveforms alongside live traces. You can apply all the same functions to the reference waveforms as you can to live waveforms, such as automatic and manual measurements, scaling and offset, and exporting to a file. Reference waveforms are especially useful for production testing and diagnostics, where they allow you to compare waveforms from the equipment under test with known good waveforms.
You can also shift the timebase of a reference waveform relative to live waveform data: click the color-coded axis control button at the bottom of the y axis for the reference waveform and adjust the box marked ‘Delay’.
Resolution enhancement is a technique for increasing the effective vertical resolution of the scope at the expense of high-frequency detail. It is useful for resolving small signal details and for reducing unwanted noise. Unlike waveform averaging it can be used on single-shot signals.

The custom probes feature allows you to correct for gain, attenuation, offsets and nonlinearities in probes, sensors or transducers that you connect to the oscilloscope. This could be used to scale the output of a current probe so that it correctly displays amperes. A more advanced use would be to scale the output of a nonlinear temperature sensor using the table lookup function.
Definitions for standard Pico-supplied oscilloscope probes and current clamps are included. User-created probes may be saved for later use.
Your PicoScope is provided with many powerful tools to help you acquire and analyze waveforms. While these tools can be used on their own, the real power of PicoScope lies in the way they have been designed to work together.
As an example, the rapid trigger mode allows you to collect 10,000 waveforms in a few milliseconds with minimal dead time between them. Manually searching through these waveforms would be time-consuming, so just pick a waveform you are happy with and let the mask tools scan through for you. When done, the measurements will tell you how many have failed and the buffer navigator allows you to hide the good waveforms and just display the problem ones. This video shows you how.
Perhaps instead you want to plot changing duty cycle as a graph? How about outputting a waveform from the AWG and also automatically saving the waveform to disk when a trigger condition is met? With the power of PicoScope the possibilities are almost endless. To find out even more about the capabilities of PicoScope software, visit our A to Z of PC Oscilloscopes.


