PicoScope 7 Software
Available on Windows, Mac and Linux
A to Z of PC oscilloscopes
Everything you need to know about PC oscilloscopes from Advanced Triggers to Zooming.

A to Z of Data Loggers
Everything you need to know about PC-based data loggers from Alarms to Zooming.
Application Notes
Details of some of the many applications for Pico data logger and oscilloscope products.

How do I measure...?
Find out how you can measure using Pico products

Videos
Showing you how to get the most out of PicoScope oscilloscope software.

Documentation
Up-to-date versions of the documentation supplied with your products in PDF format.

Educational Experiments
Our library of science experiments suitable for use with oscilloscope and data logging products.

PicoApps
Want to share hints, tips and code with other developers? Show your Pico-based products to the world.

Newsletter
Archive of our monthly Test and Measurement Newsletters.

PicoScope 9400 Series
5 & 16 GHz Oscilloscopes


The PicoSample 4 workspace takes full advantage of your available single or multiple display size and resolution, allowing you to resize the window to fit any display resolution supported by Windows.
You decide how much space to give to the trace display and the measurements display, and whether to open or hide the control menus. The user interface is fully touch- or mouse-operable, with grabbing and dragging of traces, cursors, regions and parameters. In touchscreen mode, an enlarged parameter control is displayed to assist adjustments on smaller touchscreen displays.

To zoom, either draw a zoom window or use the numerical zoom and offset controls. You can display up to four different zoomed views of the displayed waveforms.
“Hidden trace” icons show a live view of any channels that are not currently on the main display.
The interaction of timebase, sampling rate and capture size is normally handled automatically, but there is also an option to override this and specify the order of priority of these three parameters.
When working with multiple traces, you can display them all on one grid or separate them into two or four grids. You can also plot signals in XY mode with or without additional voltage-time grids. The persistence display modes use color-contouring or shading to show statistical variations in the signal. Trace display can be in either dots-only or vector format and all these display settings can be independent, trace by trace. Custom trace labeling is also available.


.
The PicoScope 9400 Series scopes quickly measure well over 40 standard waveforms and over 70 eye parameters, either for the whole waveform or gated between markers. The markers can also make on-screen ruler measurements, so you don't need to count graticules or estimate the waveform's position. Up to ten simultaneous measurements are possible. The measurements conform to IEEE standard definitions, but you can edit them for non-standard thresholds and reference levels using the advanced menu, or by dragging the on-screen thresholds and levels. You can apply limit tests to up to four measured parameters.

Waveform parameters can be measured in both X and Y axes including X period, frequency, negative or positive cross and jitter. In the Y axis measurements such as max, min, DC RMS and cycle mean are available. Measurements can be within a single trace or trace-to-trace such as phase, delay and gain.
Selection of a measurement parameter displays its values, thresholds and bounds on the main display.

Measurement thresholds and bounds are displayed for the last selected measurement parameter.
The PicoScope 9400 Series scopes quickly measure more than 70 fundamental parameters used to characterize non-return-to-zero (NRZ) signals and return-to-zero (RZ) signals.
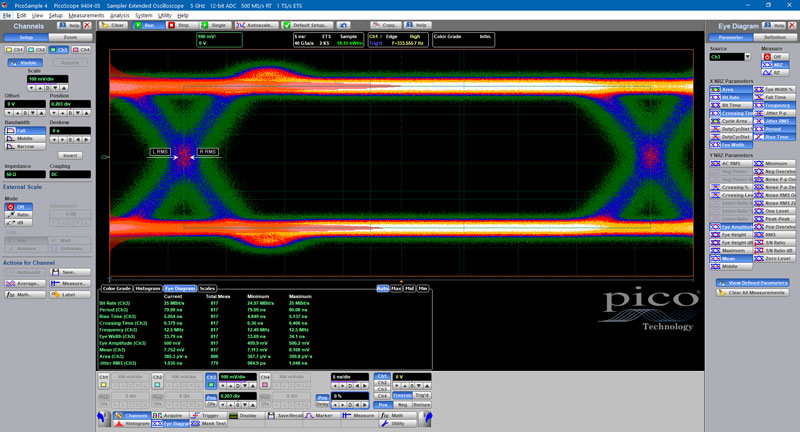
Eye-diagram analysis can be made even more powerful with the addition of mask testing, as described below.
Eye diagram analysis can display data including: bit rate, period, crossing time, frequency, eye width, eye amplitude, mean, area and jitter RMS. Also shown on the graph are left and right RMS jitter markers. These measurements are selectable from within the Eye Diagram side menu and are listed on screen below the graph.
The measurement points and levels used to generate each parameter can optionally be drawn on the trace.
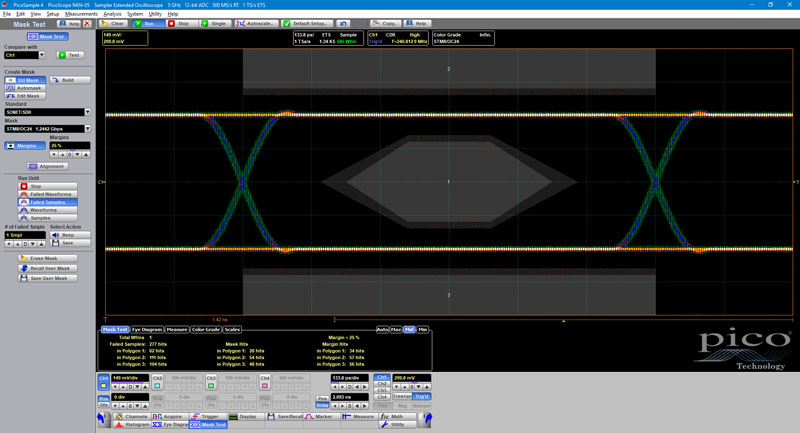
PicoSample 4 has a built-in library of over 130 masks for testing data eyes. It can count or capture mask hits or route them to an alarm or acquisition control. You can stress-test against a mask using a specified margin, and locally compile or edit masks.
There’s a choice of gray-scale and color-graded display modes, and a histogramming feature, all of which aid in analyzing noise and jitter in eye diagrams. There is also a statistical display showing a failure count for both the original mask and the margin.
The extensive menu of built-in test waveforms is invaluable for checking your mask test setup before using it on live signals.
| Mask test features | Masks | Number of masks | |
|---|---|---|---|
| 9404-05 9402-05 |
9404-16 9402-16 |
||
|
SONET/SDH | 8 | |
| Ethernet | 7 | ||
| Fibre Channel | 23 | 30 | |
| PCI Express | 29 | 41 | |
| InfiniBand | 12 | 15 | |
| XAUI | 4 | ||
| RapidIO | 9 | ||
| Serial ATA | 24 | ||
| ITU G.703 | 14 | ||
| ANSI T1.102 | 7 | ||
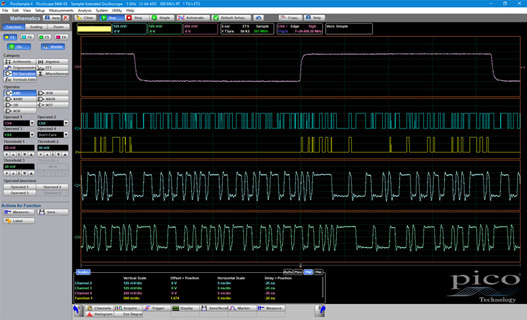
The PicoScope 9400 Series scopes support up to four simultaneous mathematical combinations or functional transformations of acquired waveforms.
You can select any of the mathematical functions to operate on either one or two sources. All functions can operate on live waveforms, waveform memories or even other functions. There is also a comprehensive equation editor for creating custom functions of any combination of source waveforms.
Choose from 60 math functions including:

Trending allows you to plot a measured time parameter, such as pulse width, period or transition time as an additional trace.

All PicoScope 9400 Series oscilloscopes can calculate real, imaginary and complex Fast Fourier and Inverse Fast Fourier Transforms of input signals using a range of windowing functions. The results can be further processed using the math functions. FFTs are useful for finding crosstalk and distortion problems, adjusting filter circuits, testing system impulse responses and identifying and locating noise and interference sources.

Behind the powerful measurement and display capabilities of the 9400 Series lies a fast, efficient data histogram capability. A powerful visualization and analysis tool in its own right, the histogram is a probability graph that shows the distribution of acquired data from a source within a user-definable window.
Histograms can be constructed on waveforms on either the vertical or horizontal axes. The most common use for a vertical histogram is measuring and characterizing noise and pulse parameters. A horizontal histogram is typically used to measure and characterize jitter.

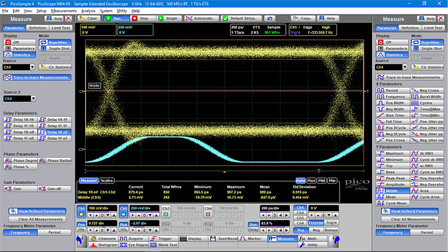
Pulsed RF carriers lie at the heart of our modern communications infrastructures, yet the shape, aberrations and timings of the final carrier pulse (at an antenna, for example) can be challenging to measure. If we choose demodulation, we are subject to the limitations of the demodulator; its bandwidth and distortions.
Envelope acquisition mode allows waveform acquisition and display showing the peak values of repeated acquisitions over a period of time.
Shown here on a PicoScope 9404 SXRTO is a real time capture of pulsed amplitude 2.4 GHz carrier.
The yellow trace is an alias of the 2.4 GHz carrier displayed at a timebase of 100 μs/div. The blue trace, offset slightly for clarity, is a Max Envelope capture of the yellow trace.
The enveloped waveform shows the maximum excursions of the carrier envelope and its pulse parameters can then be measured (bottom left of the image).
This measurement is limited by the maximum real time sampling rate of the SXRTO (500 MS/s) and so has a Nyquist demodulation bandwidth of 250 MHz. Three other channels on the oscilloscope remain available to monitor, for example, modulating data and power supply voltages or currents feeding to the sourcing RF power amplifier.

Segmented acquisition mode in the Acquire menu partitions the available trace memory length into multiple trace lengths (segments or buffers). Up to 1024 traces can then be captured and either layered or individually selected to display on screen. This is helpful for capturing and viewing rarely occurring events.

Having captured an anomalous event you can scroll through, or close gates around, an ever smaller block of overlaid traces, until the anomalous trace or traces are found. There is also a segment finder, which uses a binary search method to address larger numbers of trace segments.
The PicoSample 4 software can operate as a standalone oscilloscope program or under ActiveX remote control. The ActiveX control conforms to the Windows COM interface standard so that you can embed it in your own software. Unlike more complex driver-based programming methods, ActiveX commands are text strings that are easy to create in any programming environment. Programming examples are provided in Visual Basic (VB.NET), MATLAB, LabVIEW and Delphi, but you can use any programming language or standard that supports the COM interface, including JavaScript and C. National Instruments LabVIEW drivers are also available. All the functions of the PicoScope 9400 and the PicoSample 4 software are accessible remotely.
We supply a comprehensive programmer’s guide that details every function of the ActiveX control. The SDK can control the oscilloscope over the USB or (on four-channel models) the LAN port.


