PicoScope 7 Software
Available on Windows, Mac and Linux
A to Z of PC oscilloscopes
Everything you need to know about PC oscilloscopes from Advanced Triggers to Zooming.

A to Z of Data Loggers
Everything you need to know about PC-based data loggers from Alarms to Zooming.
Application Notes
Details of some of the many applications for Pico data logger and oscilloscope products.

How do I measure...?
Find out how you can measure using Pico products

Videos
Showing you how to get the most out of PicoScope oscilloscope software.

Documentation
Up-to-date versions of the documentation supplied with your products in PDF format.

Educational Experiments
Our library of science experiments suitable for use with oscilloscope and data logging products.

PicoApps
Want to share hints, tips and code with other developers? Show your Pico-based products to the world.

Newsletter
Archive of our monthly Test and Measurement Newsletters.

PicoScope® 3000 Series
Power, portability and performance


PicoScope software dedicates almost all of the display area to the waveform. This ensures that the maximum amount of data is seen at once. The viewing area is much bigger and of a higher resolution than with a traditional benchtop scope.
With a large display area available, you can also create a customizable split-screen display, and view multiple channels or different views of the same signal at the same time. As the example shows, the software can even show multiple oscilloscope and spectrum analyzer traces at once. Additionally, each waveform shown works with individual zoom, pan, and filter settings for ultimate flexibility.
The PicoScope software can be controlled by mouse, touchscreen or keyboard shortcuts.
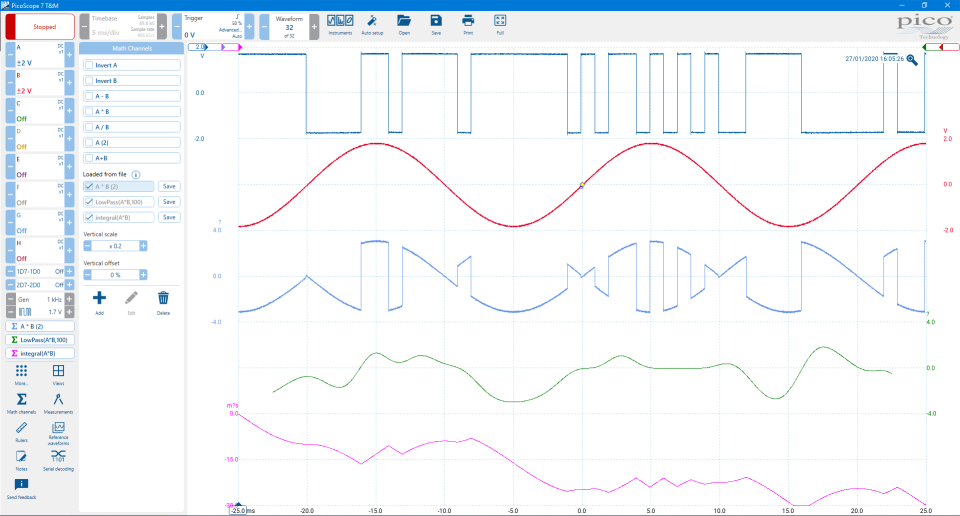
On many oscilloscopes waveform math just means simple calculations such as A + B. With a PicoScope it means much, much more.
With PicoScope software you can select simple functions such as addition and inversion, or open the equation editor to create complex functions involving filters (lowpass, highpass, bandpass and bandstop filters), trigonometry, exponentials, logarithms, statistics, integrals and derivatives.
Waveform math also allows you to plot live signals alongside historic peak, averaged or filtered waveforms.
You can also use math channels to reveal new details in complex signals. An example would be to graph the changing duty cycle or frequency of your signal over time.

The custom probes feature allows you to correct for gain, attenuation, offsets and nonlinearities in probes, sensors or transducers that you connect to the oscilloscope. This could be used to scale the output of a current probe so that it correctly displays amperes. A more advanced use would be to scale the output of a nonlinear temperature sensor using the table lookup function.
Definitions for standard Pico-supplied oscilloscope probes and current clamps are included. User-created probes may be saved for later use.
More information on Custom probes in PicoScope oscilloscope software >>

In addition to the PicoScope application software, the PicoScope Software Development Kit (SDK) is available free of charge.
The SDK allows you to write your own software and includes drivers for Windows, macOS and Linux (including beta versions for Raspberry Pi and Beaglebone).
Example code, hosted on the Pico Technology GitHub pages, shows how to interface to third-party software packages such as Microsoft Excel, National Instruments LabVIEW and MathWorks MATLAB and programming languages including:
The drivers support USB data streaming, a mode that captures gap-free continuous data over USB direct to the PC’s RAM or hard disk at rates of up to 156.25 MS/s for USB 3.0 devices. Capture size is limited only by available PC storage. Sampling rates in streaming mode are subject to PC specifications, product specifications and application loading.
Your PicoScope is provided with many powerful tools to help you acquire and analyze waveforms. While these tools can be used on their own, the real power of PicoScope lies in the way they have been designed to work together.
As an example, the rapid trigger mode allows you to collect 10 000 waveforms in a few milliseconds with minimal dead time between them. Manually searching through these waveforms would be time-consuming, so just pick a waveform you are happy with and let the mask tools scan through for you. When done, the measurements will tell you how many have failed and the buffer navigator allows you to hide the good waveforms and just display the problem ones. This video shows you how.
Perhaps instead you want to plot changing duty cycle as a graph? How about outputting a waveform from the AWG and also automatically saving the waveform to disk when a trigger condition is met? With the power of PicoScope the possibilities are almost endless. To find out even more about the capabilities of PicoScope software, visit our A to Z of PC Oscilloscopes.


